LEONIDS 2000
VISUAL RESULTS
MBK Team observations analysis
MBK Team observation analysis shows a fairly level activity during the first observing interval (0132-0246UT). Average ZHRs start at 200 and reach a small subpeak at around 2:10 UT with average ZHRs slightly under 300. Thereafter the trend depends on the observer. While ZAKJU and KACJA show remarkable similarity in ZHR with a steadily increasing trend from 200 to almost 400, ATAJU shows a rapid drop from 450 to 220. The most likely causes for the difference is the increasing cloud cover and each observers' subjective view of the cloud obstruction and the difference in perception (ATAJU's perception is 30% higher).
The second period starts at around 3:40h UT, around the predicted peak. The cloud cover at that point was over 60% so the correction factors involved are very large and thus the data has limited value. ATAJU shows a steady decreasing trend from a ZHR of almost 600 at the beginning to 250 only 45 minutes later and 180 at 5:10 UT. ZAKJU and KACJA, on the other hand, show a fairly level ZHR with KACJA's average value around 400 and ZAKJU's average value around 300.
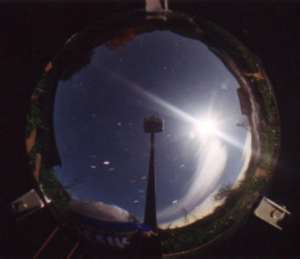
The general impression was that the Leonids were bright, somewhat brighter than an average Perseid display while fainter than the Leonid 1998 fireball outburst. Most meteors were yellow and orange, while several fireballs were also blue and green. Most left persistent trains up to 5 seconds duration, except the fireballs that left longer lasting trains.
There appears to have been some fireball activity, but this, again, is fairly different with each individual observer. In total of 2.73h teff ATAJU reports 20 fireballs, ZAKJU , while KACJA reports only 3. The brightest events were three -8m LEO fireballs at 04:21, 04:31:17 and 04:47:23. All were seen through variable thickness clouds and one left a very bright 10 seconds duration train, probably persisting for minutes under a clear sky. The longest persistent train was seen by a -6m LEO fireball at 04:50:04, lasting 80 seconds. It twisted into an S shape before disappearing.
The predicted 3:44 UT peak displays a unique activity profile. In contrast with the 1999 storm and the later ZHR 180 peak, which both displayed a rapid rise and fall, the 2000 3:44 UT peak shows strong activity at over 50% of the peak rate lasting several hours. In fact, ZHRs were over 200 as soon as observations began at 1:32 UT and were still as high at 5:00 UT. Furthermore, despite official observations ceased by 5:13 UT, casual observations indicate a further rise in ZHRs afterwards.
ZHR graph of individual MBK Team members using 15 minute counts. The ZHR was calculated using a population index r = 2.
MBK Team ZHR rates plotted with first IMO results for comparison. The ZHR rates were computed using ZHR = (1 + S nLEO) / S(Teff/C) in bins of 0.01° in l¤, shifted by 0.005°, and were then plotted at the average solar longitude in each bin. The error bars represent the standard deviation of the individual ZHRs contributing to the average.
MBK Team visual results
Nov 17/18 5-minute counts
Nov 17/18 magnitude distributions
 MBK Team photographic results MBK Team photographic results
 International Meteor Organization analysis International Meteor Organization analysis
|