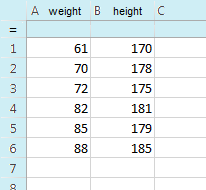
Bivariate statistics means statistics with two variables. Your TI-nspire calculator can do the complete statistical analysis if you follow the simple steps described bellow.
You can start with creating a new document:
on
An empty spreadsheet will appear on the screen.
I recommend you to label first two columns with the names of your two variables (e.g., weight and height). The names must be entered in the first row of each column.
Leave the second row empty (this row is reserved for special formulas).
Enter the data for each variable in corresponding column.
In this spreadsheet put the cursor in an empty cell (e.g. column 3, second row) and use:
menu| X List: | weight |
| Y List: | height |
| Frequency: | 1 |
| 1st Res Col: | c[ ] |
A dialog box will open. Enter the names of your variables (e.g., weight and height) in boxes at "X List" and "Y List".
At "Frequency" leave the value 1.
Specify in which column the results should be written in "1st Result Column". Normally column c[ ] or column d[ ] will be just fine.
After pressing OK button the calculator will display the results. Results include a lot of statistical parameters. The most important of them are:
x = the mean (average) of the variable xFor drawing the graph you'll have to open a new page in your document:
docClick on the axes and select the variable for each axis (e.g., weight for x and height for y axis). Your calculator will prepare the scatter graph immediately.
(4a.) On the scatter graph page the following commands can be used:
menuYou have two options for the form of the regression line: y = mx + b (term containing x first) or y = a + bx (term containing x last).
In both cases the calculator will draw the regression line on the scatter graph and write the equation of this line (in the chosen form). The coefficients are usually written with a lot of decimals – of course you can round them.
(4b.) On the spreadsheet page the coefficients of the regression line can be calculated in a similar way as when you used the TwoVar function. Put the cursor in an empty cell on the spreadsheet (e.g., column 5, second row) and use:
menu| X List: | weight |
| Y List: | height |
| Frequency: | 1 |
| 1st Res Col: | f[ ] |
A dialog box will open. Enter the names of your variables (e.g., weight and height) in boxes at "X List" and "Y List".
Specify in which column the results should be written in "1st Result Column". Normally column f[ ] or column g[ ] will be just fine (but don't use the columns occupied by the results of the TwoVar function).
After pressing OK button the calculator will display the results. Results include coefficients m and b (if you chose form y = mx + b) or coefficients a and b (if you chose form y = a + bx).