You can start with creating a new document:
on
An empty spreadsheet will appear on the screen.
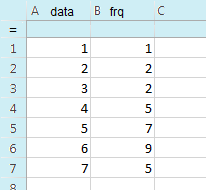
I recommend you to label the first two columns. The first column will contain data so label it data. The second column will contain frequencies so label it frq (it's shorter then frequencies). The names must be entered in the first row of each column.
Leave the second row empty (this row is reserved for special formulas).
Enter the data and frequencies in corresponding columns.
In this spreadsheet put the cursor in an empty cell (e.g. column 3, second row) and use:
menuA dialog box will open asking you about the number of lists: 1 is OK.
| X1 List: | data |
| Freq List: | frq |
| ... | |
| 1st Res Col: | c[ ] |
Then a larger dialog box will appear.
Enter the name of your data (e.g., data) in box at "X1 List".
Enter name frq in "Freq List".
Specify in which column the results should be written in "1st Result Column". Normally column c[ ] or column d[ ] will be just fine.
After pressing OK button the calculator will display the results. Results include a lot of statistical parameters. The most important of them are:
x = the mean or average