
INVERSE ESTIMATION OF EXPONENTIAL AND PIECE-WISE LINEAR APPROXIMATIONS
OF THE HARDENING CURVE FROM THE TENSION TEST
1. INTRODUCTION
The tension test (Figure 1) is widely used for the mechanical testing of materials. However, accurate estimation of plastic material properties is difficult due to the non-uniform stress/strain distribution in the necking zone[1]. Bacause of this phenomenon, it is not possible to determine the hardening parameters directly by measuring elongations at different loads. In order to determine true stress the Bridgman correction[2] is often applied which requires additional measurements of contractions at the narrowest part of the deformed sample and curvature of the neck. The approach is based on the assumptions that the contour of the neck is the arc of a circle and that strains are constant over the cross section of the neck.
In this paper an inverse approach[3-8] for the estimation of hardening parameters is considered. This approach does not require additional measurements at the necking zone and does not incorporate Bridgman's idealisations.

Figure 1. Sample geometry.
2. EXPONENTIAL APPROXIMATION
An exponential hardening law is assumed to approximate the relationship between the effective stress and effective strain:
![]() . (1)
. (1)
The unknown parameters,![]() and
and ![]() need to be derived from measured forces at certain elongations of the samples.
Two series of measurements were performed for two different steel grades. The
geometry of the samples is shown in Figure 1, while the experimental data are
given in Tables 1 and 2 for each series. Graphic presentation of the same data
for the first sample of each series is given in Figure 2.
need to be derived from measured forces at certain elongations of the samples.
Two series of measurements were performed for two different steel grades. The
geometry of the samples is shown in Figure 1, while the experimental data are
given in Tables 1 and 2 for each series. Graphic presentation of the same data
for the first sample of each series is given in Figure 2.
Table 1. Experimental data for the first series.
|
|
|
|
|
|
|
|
|
|
|
|
|
|
|
|
|
|
|
|
|
|
|
|
|
|
|
|
|
|
|
|
|
|
|
|
|
|
|
|
|
|
|
|
|
Table 2. Experimental data for the second series.
|
|
|
|
|
|
|
|
|
|
|
|
|
|
|
|
|
|
|
|
|
|
|
|
|
|
|
|
|
|
|
|
|
|
|
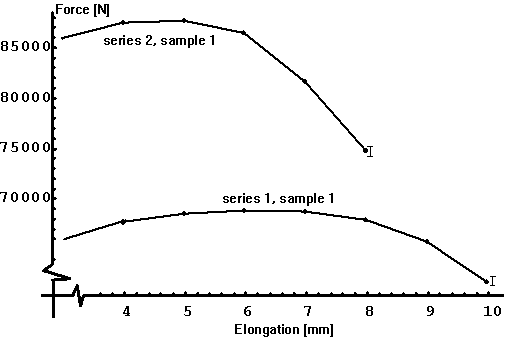
Figure 2. Masured data for the first sample of each series.
Solution of the problem was found by searching for the parameters which give the best agreement between measured and respective numerically calculated quantities. The agreement can be defined in different ways, but most commonly used is the least-square concept, mostly because of its statistical background[9,10]. The problem is solved by minimizing the function
 , (2)
, (2)
where ![]() are measured forces
at different elongations;
are measured forces
at different elongations; ![]() are
the respective quantities calculated with the finite element model by assuming
trial values of parameters C and n;
are
the respective quantities calculated with the finite element model by assuming
trial values of parameters C and n; ![]() are the expected errors of appropriate measurements and
are the expected errors of appropriate measurements and ![]() is the number of measurements.
is the number of measurements.
2.1 Results
The scatter of experimental data for the same series which is evident from
Tables 1 and 2 is mainly due to differences in samples rather than experimental
errors. This has an effect on the estimated parameters C and n. The
results are summarized in Tables 3 and 4.
Table 3. Calculated parameters C and n for the first series.
|
|
|
|
|
|
|
|
|
|
|
|
|
|
|
Table 4. Calculated parameters C and n for the second series.
|
|
|
|
|
|
|
|
|
|
|
|
|
|
|
It seems that the applied numerical model simulates bahaviour of the investigated
material adequately. This is indicated[9,10]
by the fact that the obtained values of function ![]() at its minimum were never much greater than one, assuming that the measurement
errors
at its minimum were never much greater than one, assuming that the measurement
errors ![]() in Equation 2 are one
percent of the related measured values.
in Equation 2 are one
percent of the related measured values.
3. PIECE-WISE LINEAR APPROXIMATION
The flow stress of the material is a result of different hardening and softening
phenomena which interact during plastic deformation. This interaction is often
so complex that it is difficult to predict the form of the hardening curve ![]() .
In such cases it would be desirable to find an approximation of the hardeining
curve without making any preassumptions about it. This can be done in several
ways. In this paper, an approach where points of the hardening curve defining
a piece-wise linear approximation are sought is considered.
.
In such cases it would be desirable to find an approximation of the hardeining
curve without making any preassumptions about it. This can be done in several
ways. In this paper, an approach where points of the hardening curve defining
a piece-wise linear approximation are sought is considered.
The experimental measurements used for estimation of the piece-wise linear
approximations are summarized in Table 5 and Figure 3. The data are for the
first sample of the first series, but with 16 measurements instead of 8 used
for evaluation of exponential approximation.
Table 5. Experimental data used to obtain a piece-wise linear approximation of the hardening curve.
|
|
|
|
|
|
|
|
|
|
|
|
|
|
|
|
|
|
|
|
|
|
|
|
|
|
|
|
|
|
|
|
|
|
|
|
|
|
|
|
|
|
|
|
|
|
|
|
|
|
|
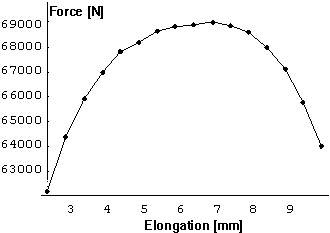
Figure 3. Measurements used for calculating a piecewise approximation of the hardening curve (measurements are for the first sample of the first series).
The points on the hardening curve were obtained by minimizing the function
 , (3)
, (3)
where parameters ![]() are values
of the curve
are values
of the curve ![]() at arbitrary equivalent
strains
at arbitrary equivalent
strains ![]() . Yield stress was known
from experiments.
. Yield stress was known
from experiments.
3.1 Results
A piecewise-linear approximations of the hardening curve were calculated for
the first sample of the first series, with 4, 6, 8 and 10 points. The results
are shown in Figures 4 to 7. The exponential harening curve with parameters ![]() and
and ![]() (as obtained by the inverse
analysis assuming the exponential hardening law) is drawn in each figure for
comparison. It is evident from these graphs that calculated piecewise linear
approximations are in relatively good agreement with the calculated exponential
approximation.
(as obtained by the inverse
analysis assuming the exponential hardening law) is drawn in each figure for
comparison. It is evident from these graphs that calculated piecewise linear
approximations are in relatively good agreement with the calculated exponential
approximation.
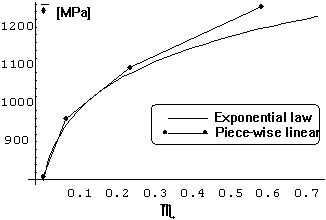
Figure 4. Comparison between exponential and piece-wise linear
(4 points) approximations of the hardening curve.
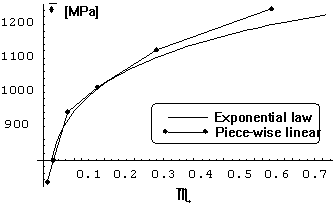
Figure 4. Comparison between exponential and piece-wise linear
(6 points) approximations of the hardening curve.

Figure 4. Comparison between exponential and piece-wise linear
(8 points) approximations of the hardening curve.
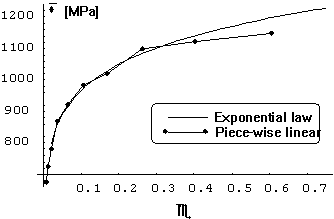
Figure 4. Comparison between exponential and piece-wise linear
(10 points) approximations of the hardening curve.
4. NUMERICAL TESTS
A number of numerical tests were performed to investigate the stability and uniquenes of the inverse solutions for the exponential approximation of the hardening curve.
Several inverse analyses were performed with very different initial guesses
and they always converged to the same results. This is the first indication
that the problem is not ill-posed. Further examination was made by plotting
the ![]() function (Figures 8 and
9). It is evident from these figures that this function has a distinctive global
minimum without local oscillations in its vicinity.
function (Figures 8 and
9). It is evident from these figures that this function has a distinctive global
minimum without local oscillations in its vicinity.
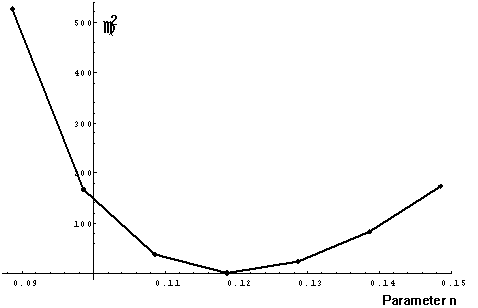
Figure 8. Dependence of function ![]() on parameter n at measured data for sample 1 of series 1. Parameter C is set
to 1271 MPa.
on parameter n at measured data for sample 1 of series 1. Parameter C is set
to 1271 MPa.
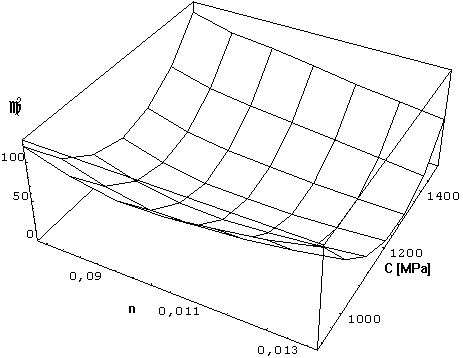
Figure 9. Dependence of function ![]() on both parameters for the same measured data as in Figure 2.
on both parameters for the same measured data as in Figure 2.
To test the stability of the solutions, a Monte Carlo simulation[11]
was performed. It was assumed that the correct values of both parameters were
known. For this purpose, the previously calculated values for the first sample
of the first series were taken, namely ![]() and
and ![]() (see Table 1). With these
values, so called "exact measurements"
(see Table 1). With these
values, so called "exact measurements" ![]() were obtained with the same finite element model used for the inverse analysis
of the real measurements. The "simulated measurements"
were obtained with the same finite element model used for the inverse analysis
of the real measurements. The "simulated measurements" ![]() were successively obtained by adding random errors
were successively obtained by adding random errors ![]() to the "exact measurements". Errors were distributed normally as
to the "exact measurements". Errors were distributed normally as
 , (4)
, (4)
where ![]() is the standard deviation
of distribution. This distribution is often used to simulate measurement errors
which do not have a clearly defined origin[10]
.
is the standard deviation
of distribution. This distribution is often used to simulate measurement errors
which do not have a clearly defined origin[10]
.
For each set of "simulated measurements" parameters C and n were
calculated. Three different sets of ![]() were chosen so that ratios
were chosen so that ratios
 (5)
(5)
were uniform within each set. Fifty numerical experiments were performed for ![]() ,
twenty for
,
twenty for ![]() and twenty for
and twenty for ![]() .
Then average values
.
Then average values ![]() and dispersions
and dispersions ![]() of the searched parameters were calculated for each set, according to
of the searched parameters were calculated for each set, according to
 (6)
(6)
and
 . (7)
. (7)
The results are summarized in Table 10. Figure 10 shows the whole distribution
of calculated parameters at ![]() .
.
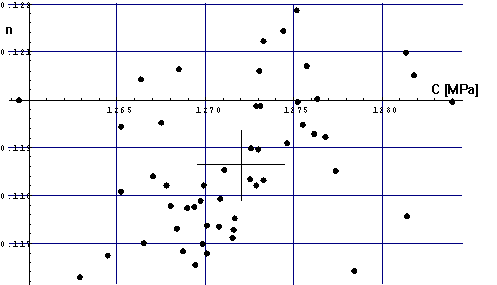
Figure 10. Results of the Monte carlo simulation for ![]() .
.
Table 5. Results of Monte Carlo simulations: Average values and dispersions of
calculated parameters at different ![]() .
.
|
|
|
|
|
|
|
|
|
|
|
|
|
|
|
|
|
|
|
|
|
|
|
|
|
5. CONCLUSION
An inverse estimation of the exponential and piece-wise linear approximations of the hardening curve from the tension test is presented. Force measurements at different elongations were used as input to the inverse analysis. The solution system is implemented as a computational shell arround the Elfen finite element[12] code. An important advantage of this approach is that parameters are derived by using the same numerical model which is then applied in direct simulations.
Numerical tests show that the evaluation of the exponential approximation is well conditioned, that no problems with uniquenes of the solutions were present and that it provides better fit then all piece-wise linear approximations considered in this paper. This suggests that exponential law describes characteristics of the investigated material well.