III MY RESEARCH WORK
I - 1) WHAT IS SPECTROMETER AND HOW DOES IT OPERATE?
The light of an object is passed through a slit which is in the focal point of
collimating lens (collimator) copying the slit into infinity. In this way, parallel
rays are produced which are then dispersed into spectrum colours by prism or
by diffraction grating (deviation net)
along wavelengths (colours). This light is then recollected with focusing lens on
the display, film or CCD-chip. What we get is a picture of a slit (line) in different
colours, wavelengths. It is therefore possible to make out from the wavelength
distribution which elements are represented in the object, the light of which is
observed, measured. If the lines are moved, this can for instance also refer to
the motion of bodies, however, if the lines are split, also to the presence of
magnetic field. The width of spectral lines is to a great extent determined by
temperature, as it is well known that simply due to Doppler.
A temperature is proportional to a square molecule's velocity, so we can
estimate the variation of wavelenght due to temperature
(  ).
).

The origin of emission and absorption spectrum.

Spectrometer scheme.
II - 2) THE USE OF SPECTROMETRY
The most important method for the establishing of:
space bodies' composition,
temperature,
space bodies' velocity
and indirectly the use in numerous other measurements (double stars, establishing
the supernova types, distance measurements ...).
III - 3) MY RESEARCH WORK
Due to the development of some kinds of technologies, in the past few decades the
astronomy has made huge progress. In this development, spectrometry has played an important
role as a large part of modern astronomy and discoveries would not be possible without it. Since
the equipment at our school is good enough and due to spectrometry popularity in astronomy,
I have decided to write research work with this topic. Firstly, I recorded all main star types and measured
them with emission spectrum of neon and helium for which I knew the wavelengths of spectrum lines.
In all measurements I used diffraction grating with hundred lines per millimetre, CCD camera ST7
and 10 inch ("=2.54 cm) Mead S-C telescope.
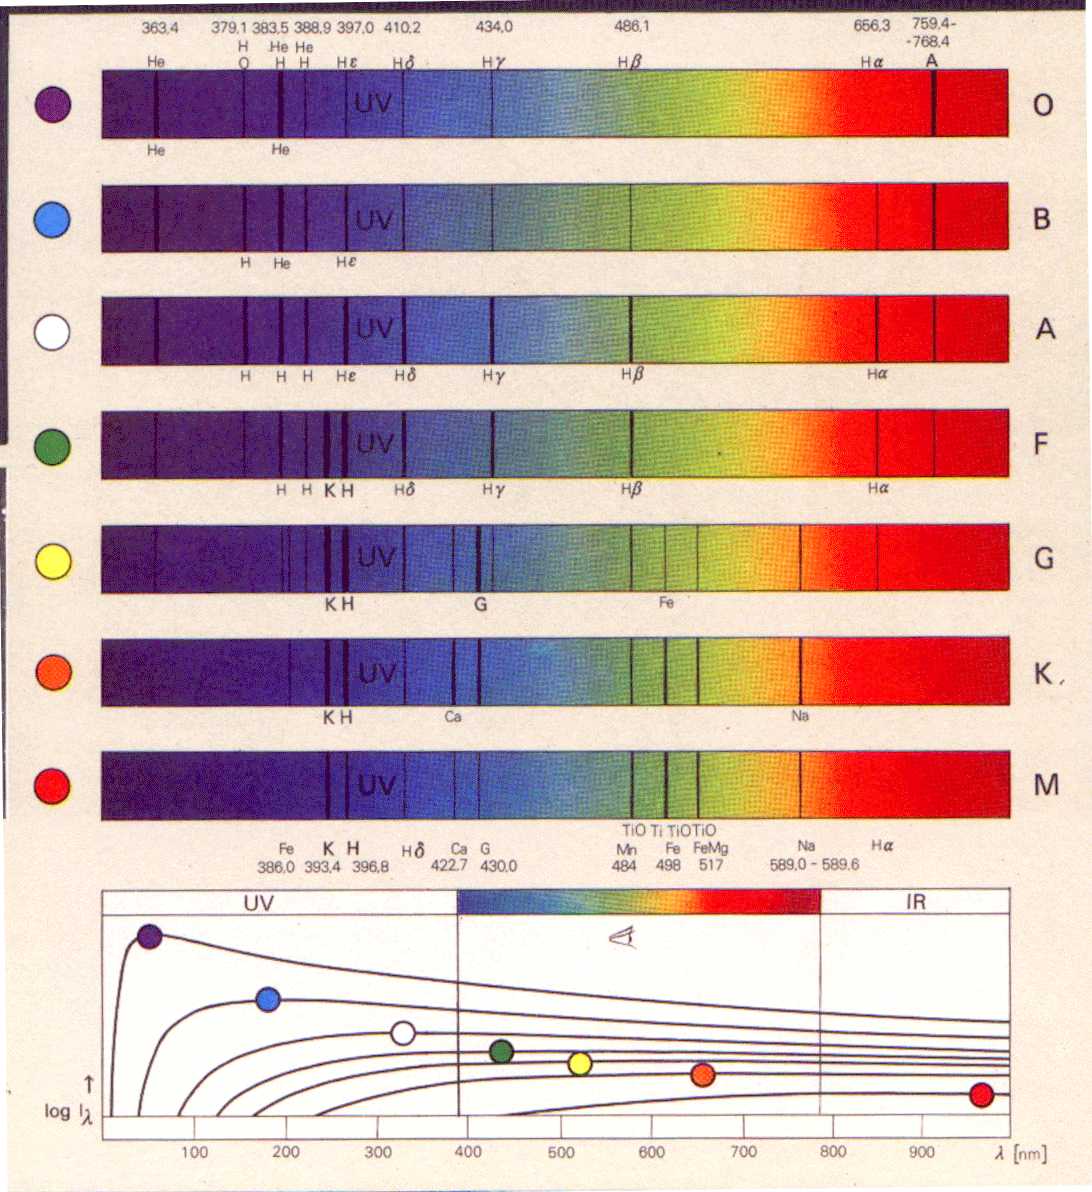
The stars are classified in the s.c. spectral types regarding the fact which absorbtion lines keep
appearing in star spectrums. If the star did not have an atmosphere, its spectrum would be
zvezen (similar to black body radiation with radiation intensity in individual wavelengths
being distributed according to Planck law - connection or Wien law). However, with stars
having an atmosphere, this absorbs part of light. The absorbed photons (absorption lines
in spectrum) are of those wavelengths typical of emission lines of atoms, molecules and ions
of the star's atmosphere. In that way, thecomposition of a star can be determined, its temperature...
See graph below.
My truly simple spectrograph will serve the possibility of star classification in spectral types.
A spectrograph is really simplified, as I will directly bend the star's picture which is not entirely
dotted; the results are nevertheless not bad. All the rest (slit, collimator...)
would require a lot more mechanical work, money and time. However, the diffraction grating
and CCD are enough for a start.
Absorption star spectra and comparative theoretical Planck's graphs
(dj/dl=(2phc2/l5)(ehc/lkT-1)-1)
for the black body radiation.
4) The making of a spectrograph
A slitless spectrograph is probably the simplest form of spectrograph that an amateur astronomer can build.
The three main components of the system are the telescope, diffraction grating, and a detector.
Virtually any form of telescope will work as long as it has quality optics and a sturdy mount.
The diffraction grating is a transmission grating which is readily available. The detector can be either
a photographic or CCD camera.
Calculation for a slitless spectrograph:

uklonska mrezica = diffraction grating
svetloba iz teleskopa = light from telescope
dolina spektra = length of spectra
uklonska mrezica 100/mm = number of grooves per mm = 100 g/mm
Examples of spectra recorded with CCD
Calibration (adjusting) with the neon spectrum

Spectrum of the Capella star.

5) Main star spectral types
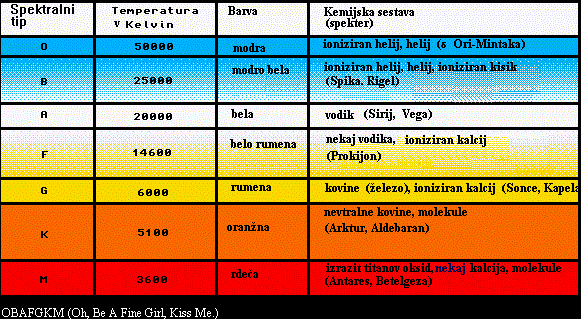
Main Sequence Star Properties
| Color | Class | solar masses |
solar diameters | Temperature | Prominent Lines |
| bluest | O | 20 - 100 | 12 - 25 | 40,000 |
ionized helium |
| bluish | B | 4 - 20 | 4 - 12 |
18,000 | neutral helium, neutral hydrogen |
| blue-white | A | 2 - 4 | 1.5 - 4 | 10,000 |
neutral hydrogen |
| white | F | 1.05 - 2 | 1.1 - 1.5 |
7,000 | neutral hydrogen, ionized calcium |
| yellow-white | G | 0.8 - 1.05 |
0.85 - 1.1 | 5,500 | neutral hydrogen, strongest ionized calcium |
| orange | K | 0.5 - 0.8 | 0.6 - 0.85 |
4,000 | neutral metals (calcium, iron), ionized calcium |
| red | M | 0.08 - 0.5 | 0.1 - 0.6 |
3,000 | molecules and neutral metals |
http://www.astronomynotes.com/starprop/s12.htm
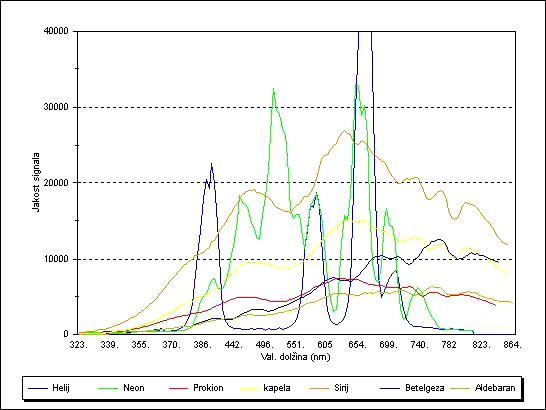
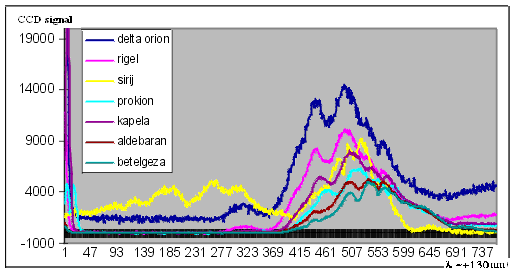
6)The following are star spectra recorded with our simple method..
Abscissa and ordinate have no units, as graphs serve solely for the comparison, they are referential.
They can be used for the estimation of unknown spectral star types. Abscissa is a measure for the
wavelength and ordinate is a CCD signal, which is a measure for the number of vpadli photons, of
which the majority (over 60%) causes photoeffect inside semi-conductor (the photon drives the electron out).
Tip O
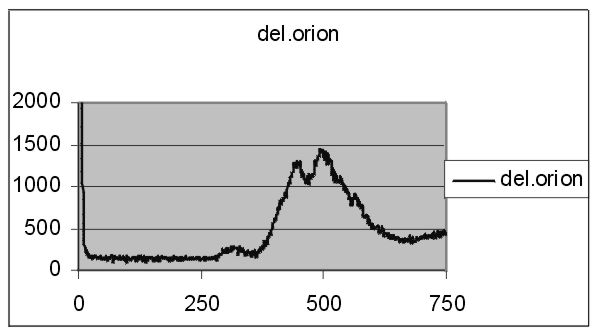
Delta in Orion
Tip B
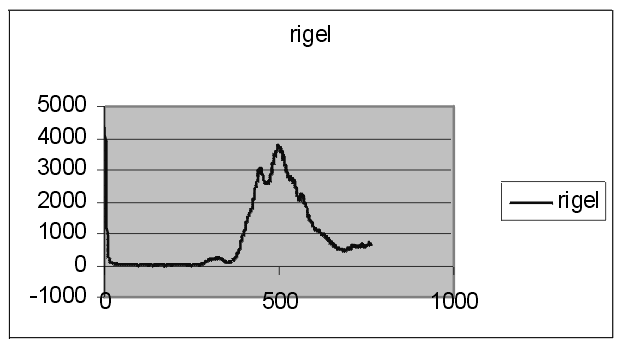
Rigel
Tip A
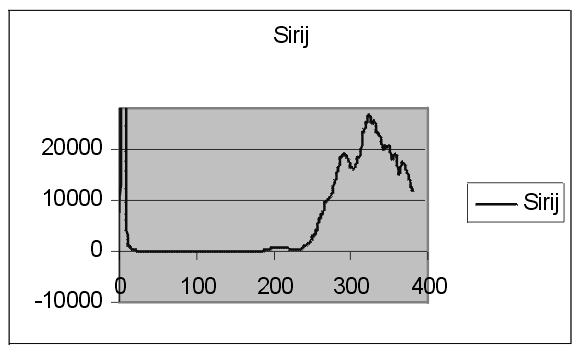
Sirius
Tip F
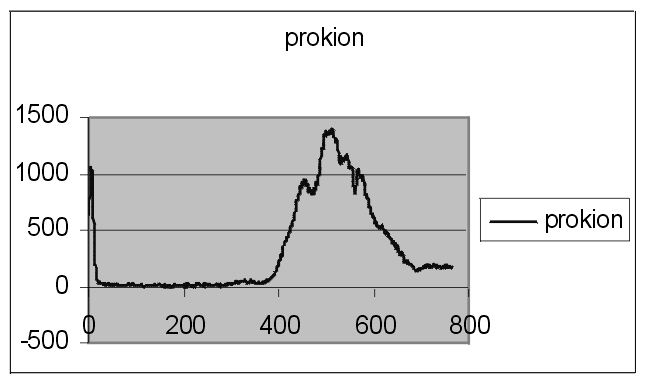
Procyon
Tip G

Capella
Tip K
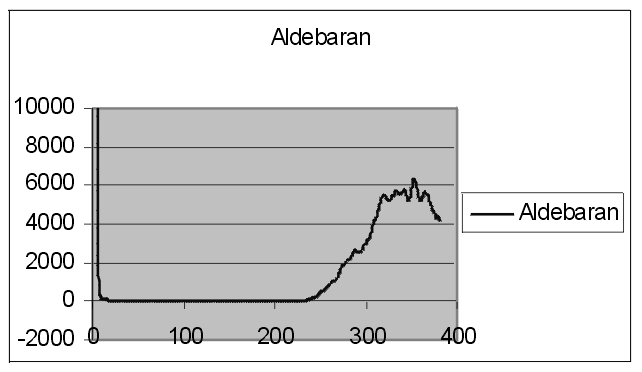
Aldebaran
Tip M
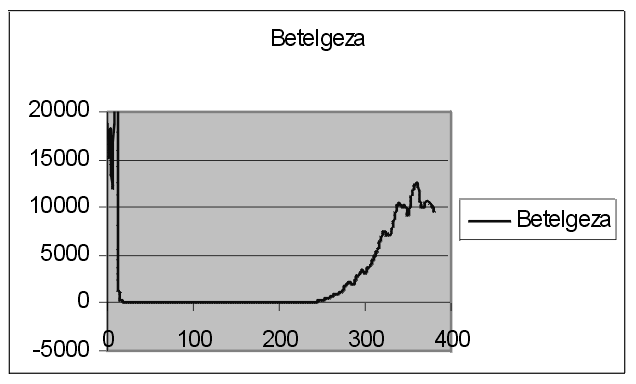
Betelgeuse
7) Calibration of a spectrograph
I have calibrate the spectrograph in the way that I recorded all star types and helium as
well as neon spectra at the same conditions and adjustments. In that way I made the following
calibration graph from which it is possible to read approximately the wavelengths with the
precision being,
according to the conditions, a few nm estimation: [1 pixel = (2mm/6.9mm)*(765/400)nm=1,8 nm => 2 nm].
The graphs' purpose is therefore more of a comparative value and the wavelength is
only estimated from the graphs. Only adjusting graph is arranged according to the
wavelengths. The graphs are used more as referential spectra for searching spectral
types of unknown stars. Also the stars are not dotted due to the Earth's atmosphere
influence, therefore there is partial covering of neighbouring wavelengths appearing.
Resolvance of Grating by professional device ==>

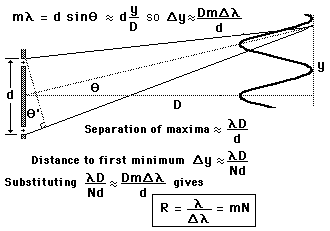
Theoretical resolvance R for my spectrograph ( N=10mm*100/mm=1000 is the
absolute number of grooves, series m=1, vawelenght = 500 nm)
is spread of vawelenght = [vawelenght/(m*N)] = 0.5 nm
==> R= vawelenght/(spread of vawelenght) = 1000.
According to the conditions is worse, we can resolve only a few nm.
Spectrographs are considered low resolution when they have R<1000.
Calibration graph.
I have also prepared the comparison between black body radiation and a
graph composed from star spectra. It is possible to see clearly from this graph
that a body's maximum at higher temeprature is shifted towards lower wavelengths.
My graphs are calibrated only in the span of visible light, as unfortunately our school
ccd camera does not perceive neither ultraviolet nor infrared light of longer wavelengths
which are also strongly filtered by the Earth's atmosphere.
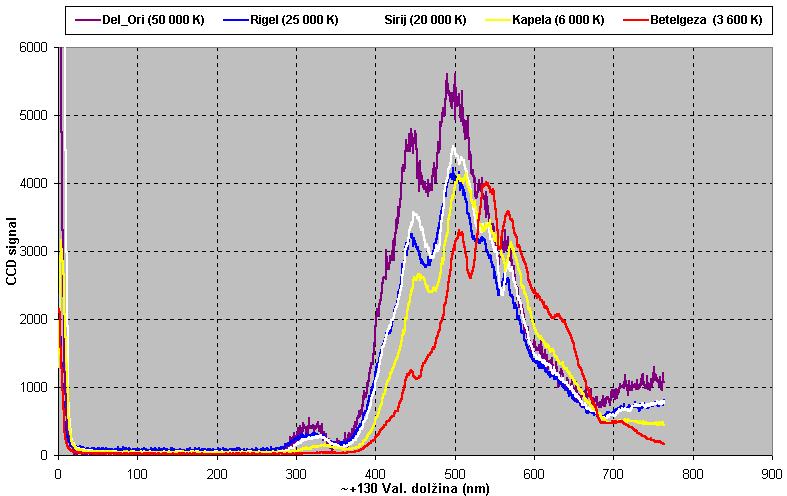
Planck radiation distribution measured with a spectrograph
(dj/dl=(2phc2/l5)(ehc/lkT-1)-1)
at different temperatures (star types) and at the same time the confirmation of Wien law:
l*T=2897Kmm.
In star spectra, it is of course possible to perceive explicit absorption lines, but the shift of spectra to the
right with regard to the decreasing surface star temperature, is obvious. We must by all means take into
account the fact that a CCD camera ST7 is limited to wavelengths between 400 and 900 nm. The space proves
to be an ideal laboratory in this case for research work of this kind; if we wanted to reach temperatures of
50 000 K in school laboratory, this work would probably not exist. However, with the help of stars such
graph is relatively quickly and simply recorded.
The absorption spectra of stars and comparative theoretical Planck graphs for black body radiation.
8) Determining unknown star types
In the end I used made spectrograph and its graphs in an attempt to determine some star
types which I did not know. Presented are two examples.
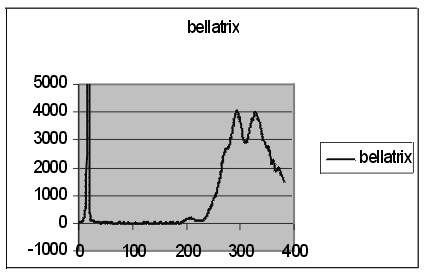
In this example I determined the type to Bellatrix star, the spectrum of which I did not know before.
Because of different vseki (jaggedness) towards the end of a graph it was determined B type.
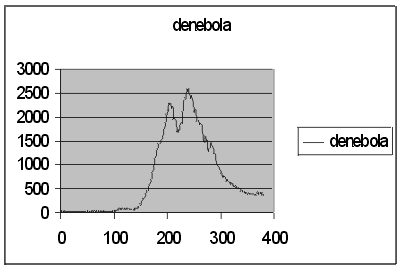
It was much easier to determine Denebola's spectrum, as the spectrogram is in entire length similar to
Delta Orion's, therefore I placed it in A type.
Both above mentioned determinations are correct.
9) Conclusion
My purpose was to make a spectrograph with tools (knowledge) available at school.
I think that such slitless spectrograph is, despite its simplicity, suitable for the use at school
and in school activities as teaching aids. It can help us learn how to calibrate a devices and
at the same time we
can determine spectral types of unknown stars which was also my objective.
Matija Kastelic
Year 2002-2003
 Slovenian text.
Back to the
first page.
xx
yy
zz
uu
vv
tt
qq
pp
AAA
bb
cccc
-----Lokalno cccc