-

DRONE IN A WIND TUNNEL
physical quantities of the forces
of the relative motion of a drone -

DRONE – PHYSICS MEASUREMENTS
the impact of crosswind
active horizontal force
Horizontal
velocity

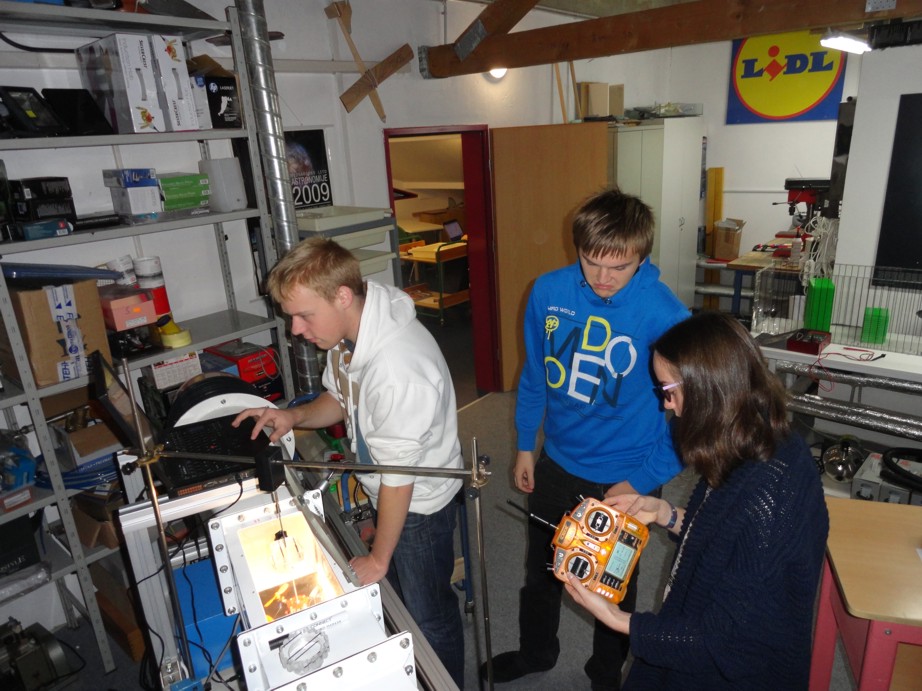
Sensor was attached vertically to the vessel's air buoyancy.
We predicted: HORIZONTAL VELOCITY WILL DECREASE AIR BUOYANCY AND THUS DISABLE THE LIFT-OFF OF THE VESSEL.
-
PHYSICS MEASUREMENTS
Vertical force is measured at the time of the launch of drone's rotors and influences the horizontal components of relative velocity.
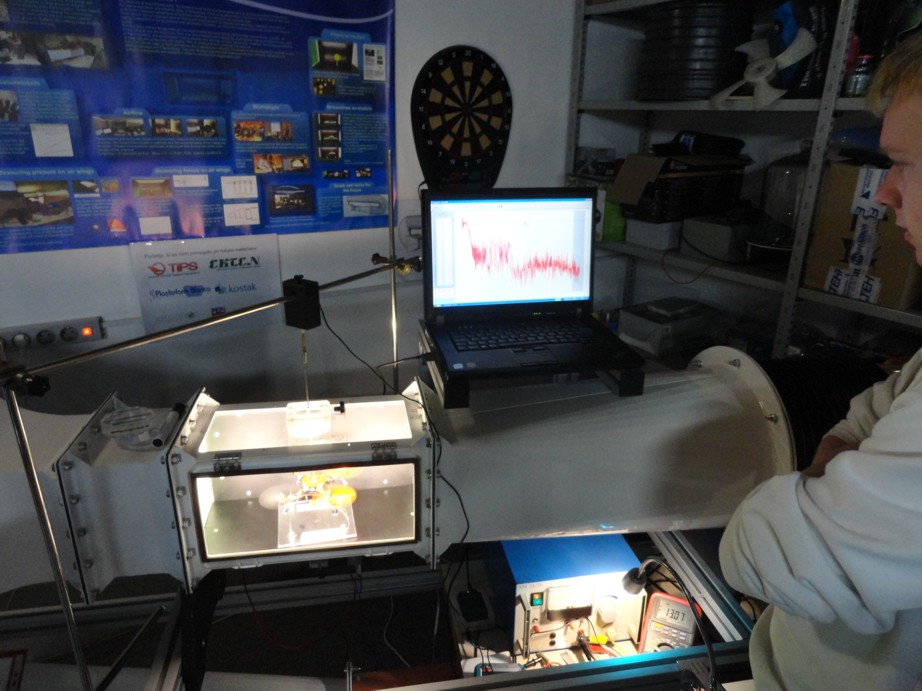
Force sensor Dual-Range Force Sensor DFS-BTA Vernier is connected via interface to the computer programme Logger Pro. Measurement period is 30 seconds and the measurement frequency 50/s. -
RESULT ANALYSIS
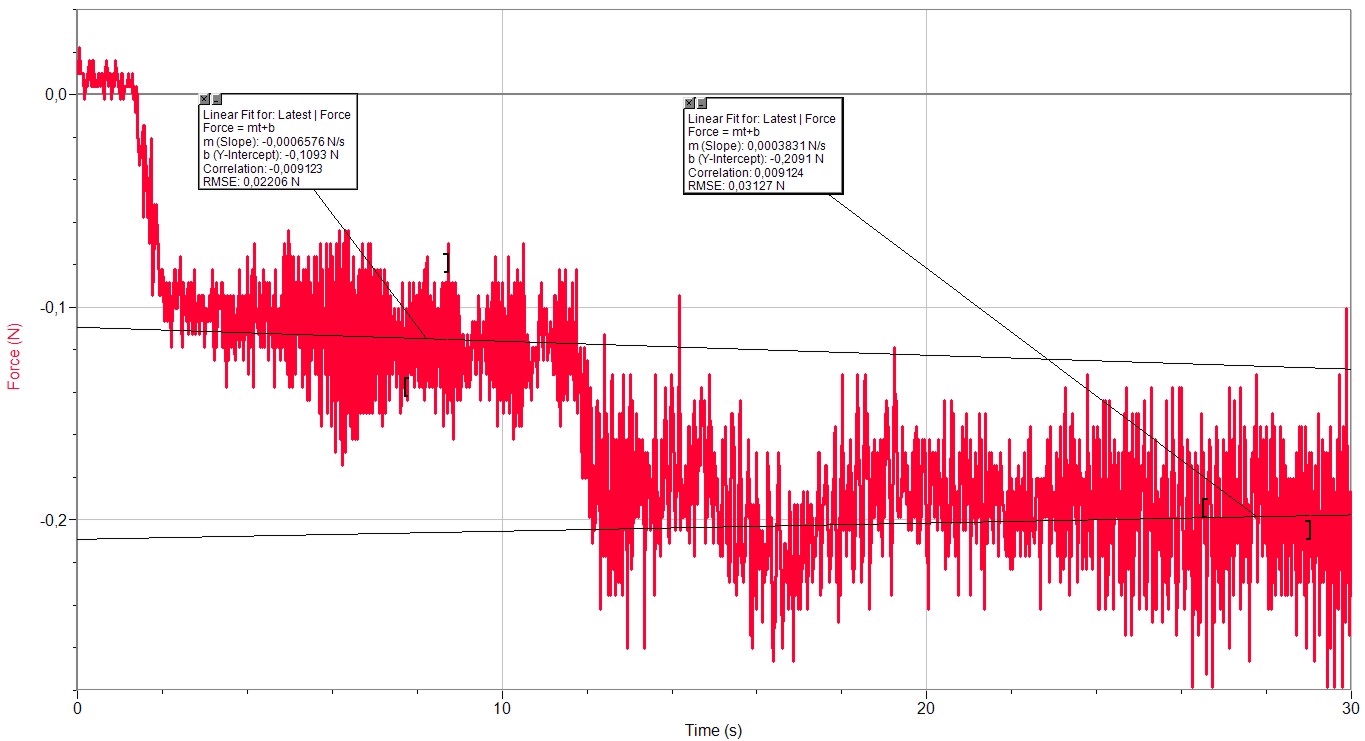
The gauge accuracy at 0.001 N combined with a high frequency of measurements results in a diagram, which needs to be evaluated according to the average segments of measurements.
Vessel launching force is therefore increased from -0.1093 N to -0.209 N. It is increased by almost 52 %.
-
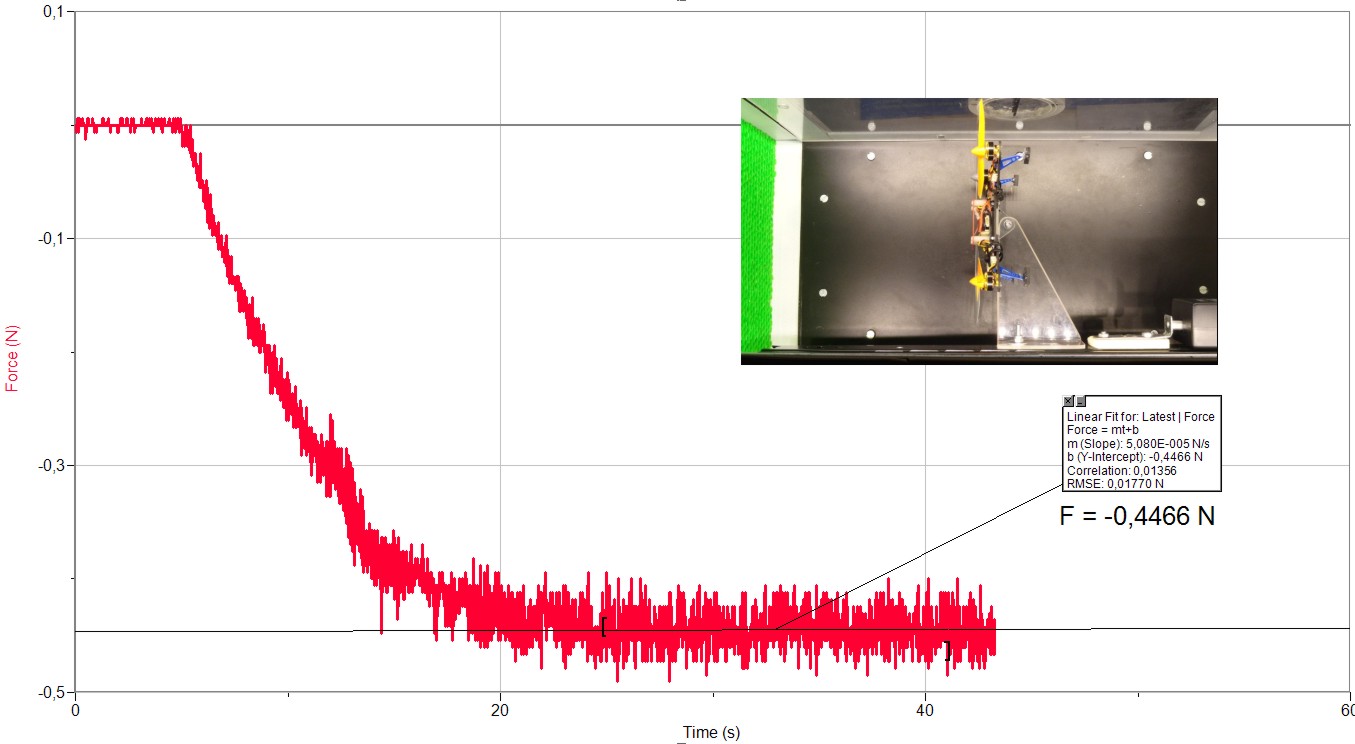
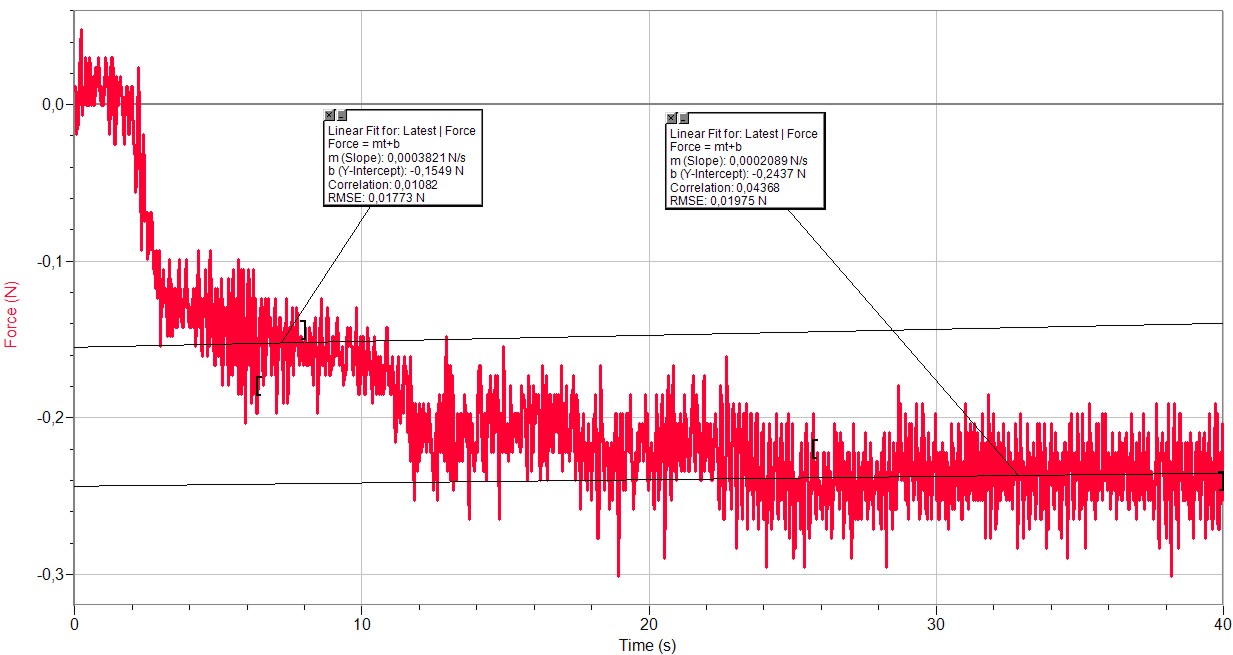
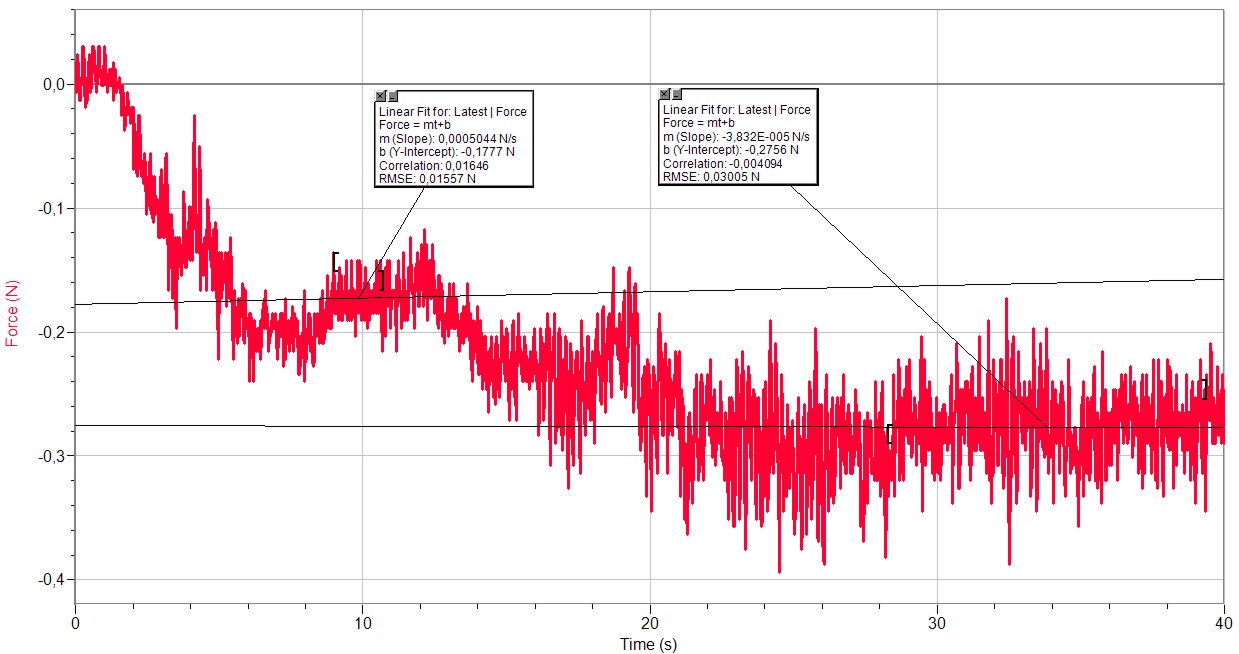
MEASUREMENT DIAGRAM
Diagram presents measurement section A, where no impact of air velocity in the wind tunnel is detected. At this time gauge records only the force of drone's rotors rotation (uplift force)..
Section B presents data related to the wind tunnel launching and the impact of the horizontal air force (relative velocity).
The result is an average force of uplift. The speed of air mass increased the uplift force. Air buoyancy of the vessel increased. -
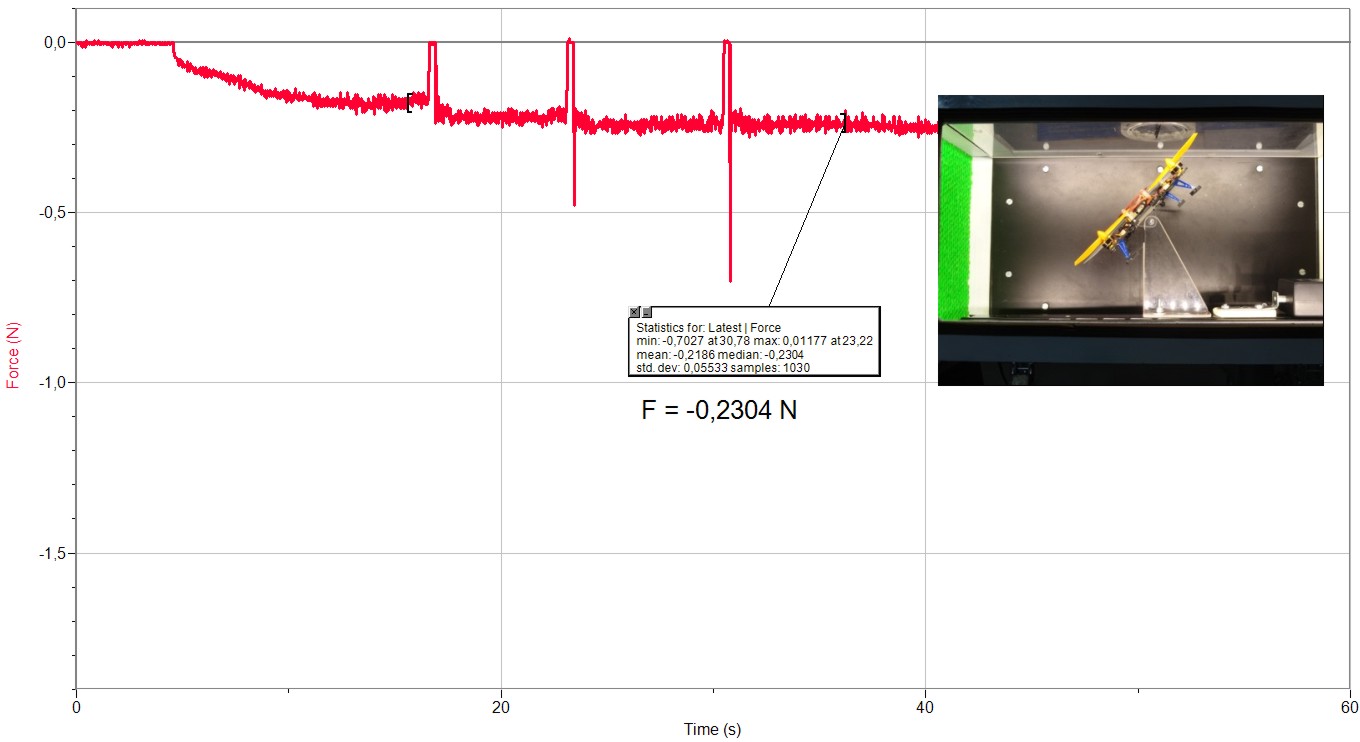
MEASUREMENTS – FORCE COMPONENTS

MEASUREMENT SERIES
The picture shows air velocity vectors (v), which represent relative movement. The uplift force (F) of a drone is directed vertically at the gauge.
In Series 1 and Series 2 tabs there are two charts from all measurements.


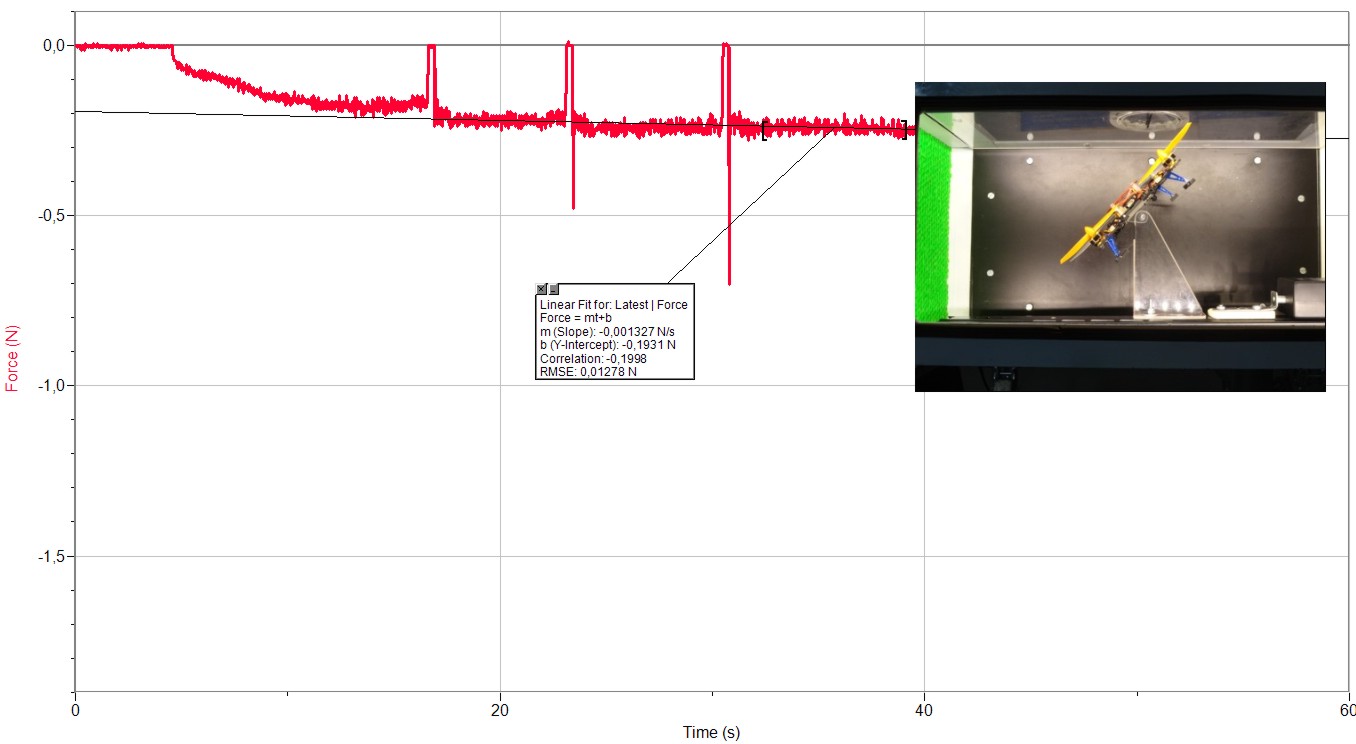
Series 1
The series of measurements show constant increase of the aerodynamic drag force. Force Fp is the result of drone's motor power. This force is, however, limited due to a fixation of the drone to the measurement instrument. We can observe a very constant change of force caused by the air flow of the wind tunnel. Measurment Nr4 is an exception, therefore we believe it could be applied to an error in measuring. It was probably caused by the contact of the beam and the measurement chamber.

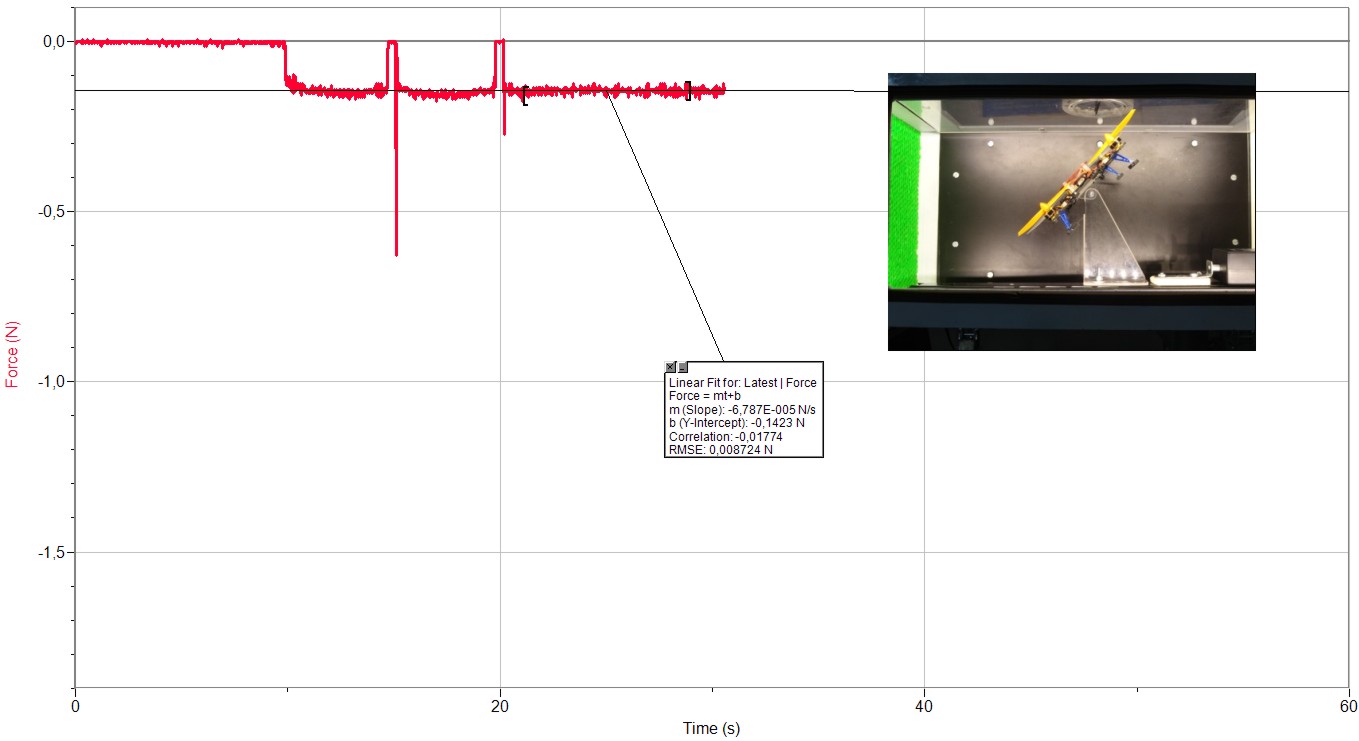
Series 2
In the second series we have measured at a lower speed of 2,92m/s. We also improved the beam connection, which caused an even bigger change of force and thus an even bigger change of aerodynamic drag force at a relative side-movement of drone. This force increases the buoyancy of a drone by approximately 80% . It also confirms our assumption that such influence is the highest at a lower speed.

LIMITATIONS
Force gauge Dual -Range Force Sensor DFS-BTA Vernier yet again proved to be a very reliable piece of equipment. Accuracy of measurements exceeds our requirements.
Measurements could be improved with improved mounting (a stand) of a gauge and improved rigidity of the system. Some differences in measurements could be attributed to the bus, upon which the drone was fitted.
The friction between the bus and the opening in a measuring chamber could be reduced with a special sliding lead-in.

PROBLEMS
The greatest problem with all measurements was the continuity of drone's power supply. Battery providing supply for the drive and the steering of a vessel has a very small capacity. Drone as a machine consumes too much electricity in comparison with the power supply capacity. The voltage in batteries rapidly dropped to the minimum thus enabling only short-term relevant measurements. Charged battery's maximum voltage was 4.2V. As the voltage dropped to merely 3.8V, there were problems with the remote signal reception and the constancy of rotor frequency. The picture shows air velocity vectors (v), which represent relative movement. The uplift force (F) of a drone is directed vertically at the gauge. In Series 1 and Series 2 tabs there are two charts from all measurements.
MEASUREMENT DIAGRAMS – FORCE COMPONENTS

Velocity v = 4,69 m/s
Velocity v = 6,18 m/s

Velocity v = 7,7 m/s

Velocity v = 8,85 m/s
Velocity v = 9,9 m/s

Velocity v = 2,92 m/s

Velocity v = 4,69 m/s
Velocity v = 6,18 m/s

Velocity v = 7,7 m/s

Velocity v = 8,85 m/s

Velocity v = 9,9 m/s
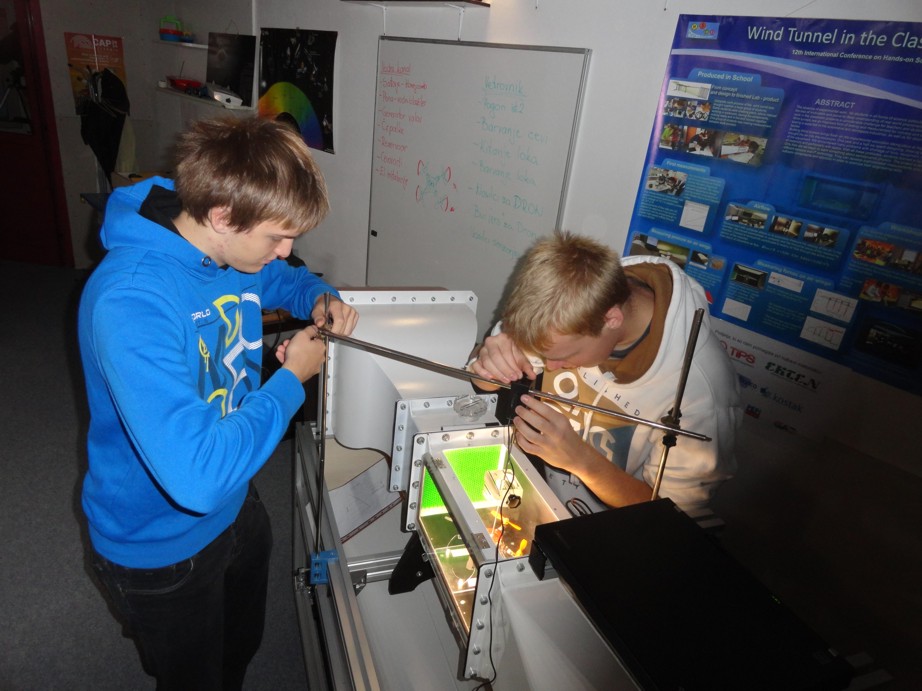
GALLERY


AERODYNAMIC DRAG
While moving and flying, drone assumes various positions due to its orientation and inclinations at the changes of course
as well as the relative situations such as the impact of wind.
Measurement 2 encompasses the impact of aerodynamic drag in the measuring chamber of the wind tunnel in different positions of the vessel.