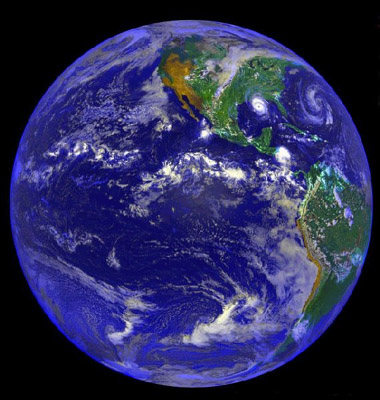
 Hurikan Andrew
Vir: F. Hasler, M. Jentoft-Nilsen, H. Pierce, K. Palaniappan, inM.
Manyin. NASA Goddard Lab for Atmospheres - Podatki iz National Oceanic and
Atmospheric Administration (NOAA)
ZGRADBA ZEMLJE
Zemeljska skorja sestoji iz litosferskih ploḟè (devet veèjih in okoli 20 manjḟih). Gostota skorje znaḟa od 2,6 do 3,3 g/cm3 kar je povpreèna gostota veèine kamnin.Litosferske ploḟèe so v kontinentalnem delu veèinoma zgrajene iz granita (SiAl) in debele do 80km, v oceanskem delu pa iz teṁjega bazalta (SiMa) ter so debele okoli 12km. Zaradi lavinih tokov v globinah Zemlje se litosferske ploḟèe premikajo. Teorijo o potovanju litosferskih ploḟè (teorija o tektoniki ploḟè) je postavil Alfred Wegener leta 1915. Na mestih kjer se ploḟèe razmikajo (npr. Srednjeatlantski hrbet) nastaja nova zemeljska skorja, na mestih kjer se ploḟèe pribliṁujejo (npr. Marianski jarek) pa se tanjḟe oceanske ploḟèe podrivajo pod debelejḟe kontinentalne. V globinah se oceanske ploḟèe raztalijo. Med ploḟèami lahko pride tudi do boènega trenja (prelomnica Sv. Andreja pri San Franciscu) ali èelnega trèenja (trk Indijske podceline z Azijo ter nastanek Himalaje).
Skorjo in magmatsko plast imenujemo s skupnim imenom litosfera. Magmatska plast je del zgornjega plaḟèa. Gostota plaḟèa znaḟa od 3,3 do 6,7 g/cm3. Zgornji plaḟè naj bi bil predvsem iz olivina in piroksina, spodnji pa iz silicija, magnezija, kisika, ṁeleza in aluminija.
Zunanje jedro naj bi bilo tekoèe, notranje pa trdno. Sestavljeno naj bi bilo predvsem iz niklja in ṁeleza. Gostota jedra je ocenjena na 10 do 15 g/cm3. Temperatura v srediḟèu jedra naj bi bila okoli 7500K.
Zemlja je najgostejḟe znano telo v naḟem osonèju. Kemièna sestava Zemlje po masi: 34,6% ṁelezo, 29,5% kisika, 15,2% silicija, 12,7% magnezija, 2,4% niklja, 0,05% titana
V osnovi je Zemlja iz ḟestih plasti:
| Skorja | 0-40 km |
| Magmatska plast | do 100 km |
| Zgornji plaḟè | 100 do 1200 km |
| Spodnji plaḟè | 1200 do 2900 km |
| Zunanje jedro | 2900 do 5150 km |
| Notranje jedro | 5150 do 6378 km |
ZEMELJSKO POVR©JE
Oblikujejo ga enodogene in eksogene sile. Vzrok za endogene sile so podzemni tokovi magme, ki premikajo litosferske ploḟèe. Posledica gibanja litosferskih ploḟè so gubanja povrḟja, prelomi, potresi in ognjeniḟka aktivnost. Eksogene sile so preperevanje, denudacija, erozija in akumulacija. Eksogeni procesi iznièujejo posledice endogenih sil.
| Oddaljenost od Sonca | najveèja 152.000.000 km |
| najmanjḟa 147.000.000 km | |
| Obhodni èas | 365,3 dni |
| Vrtilni èas | 23 ur, 56 minut in 4 sekunde |
| Sploḟèenost tira | 0,017 |
| Naklon tira | 0 |
| Naklon osi | 23,4 stopinj |
| Ubeṁna hitrost | 11,18 km/s |
| Masa | 5,97 x 10 na 24 kg |
| Gostota | 5,52g/cm3 |
| Gravitacijski pospeḟek | 9,8 m/s2 |
| Povrḟinska temperatura | 22 stopinj C |
| Albedo | 0,36 |
ATMOSFERA
Je plinast plaḟè okoli Zemlje, ki oslabi in vpije sonèevo ali kozmièno sevanje. Atmosfera vsebuje 77% duḟika, 21% kisika, 0,93% argona, 0,03% ogljikovega dioksida, ozon, vodne pare, praḟne delce Kemièna sestava zraka se od morske gladine do velikih viḟin naèeloma ne spreminja bistveno, zato pa se spreminja gostota (vsakih 5.000 metrov se gostota prepolovi).
Plasti atmosfere:
| Troposfera | 0-12km (8km nad poli do16km nad ekvatorjem) |
| Stratosfera | do 50km (v tej plast je ozonska plast) |
| Mezosfera | 50 do 80 km |
| Termosfera | 80 do 800 km (v tej plasti je ionosfera) |
| Eksosfera | nad 800km |
ZEMLJIN SATELIT
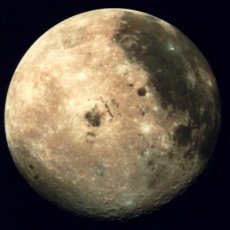
Luna je edini Zemljin naravni satelit in nam najbliṁje nebesno telo. Zaradi tega je tudi vedno privlaèil pozornost ljudi. Pravilnost njegovih faz se je ṁe v zaèetku èloveḟtva uporabljala za merjenje èasa. Srednja odaljenost Lune od Zemlje znaḟa 384 000 km. Njegova kroṁnica je eliptiène oblike. Premer naḟega naravnega satelita je 3476 km. Po svoji velikosti je Luna eden izmed najveèjih satelitov v Sonènem sistemu. Masa Lune je 81 krat manjḟa od mase Zemlje.
Teleskopska opazovanja so nam ṁe davno pokazala da Luna nima atmosfere. Vesoljski poleti in spust prvih ljudi na Luno so to popolnoma potrdili. Zaradi tega na Luni ni vode ali katerekoli druge tekoèine. Njegova gravitacijska sila je mala in ne more zadrṁati mulekule plinov. Tudi èe bi voda obstajala, bi izparela pod vplivom Sonènega sevanja in na koncu bi pobegnila v vesolje v obliki vodne pare.
®e z prostim oèesom je mogoèe opaziti osnovne oblike reliefa na Luni. To so velike temne povrḟine, katere so si ljudje v preteklosti napaèno predstavljali kot morja. To so v bistvu velike ravne povrḟine. Ko se pogledajo skozi teleskop, se opazi da so spresekane z velikim ḟtevilom kraterjev, razpok in brazd.
Najzanimivejḟe oblike reliefa so kraterji. Premeri se jim gibljrjo od nekaj metrov do 240 km (Klavius in Grimaldi). Ti kraterji imajo ponavadi izgled kroṁnih povrḟin zagrajenim s prstanovim zidom. V srediḟèu se pogosto nahaja vzpetina. Poleg kraterjev imamo na Luni tudi planinske verige in kanjone.
Najveè podatkov o Luni je bilo dobljeno od prvih vesoljskih poletov k njej. Najprej so podatke prenaḟale ameriḟke in ruske sonde, pozneje pa tudi ljudje, ki so bivali na njej. Nova raziskovanja so pokazala, da je eno ḟtevilo kraterjev vulkanskega porekla in da so nastali v zgodnji zgodovini Lune. Drugi, veèinoma manjḟih dimenzij, pa so nastala z udarci meteoritov v tla Lune. Raziskovanja koḟèkov Luninih kamenin so pokazala, da so nekatere kamenine stare 4,6 miljard let.
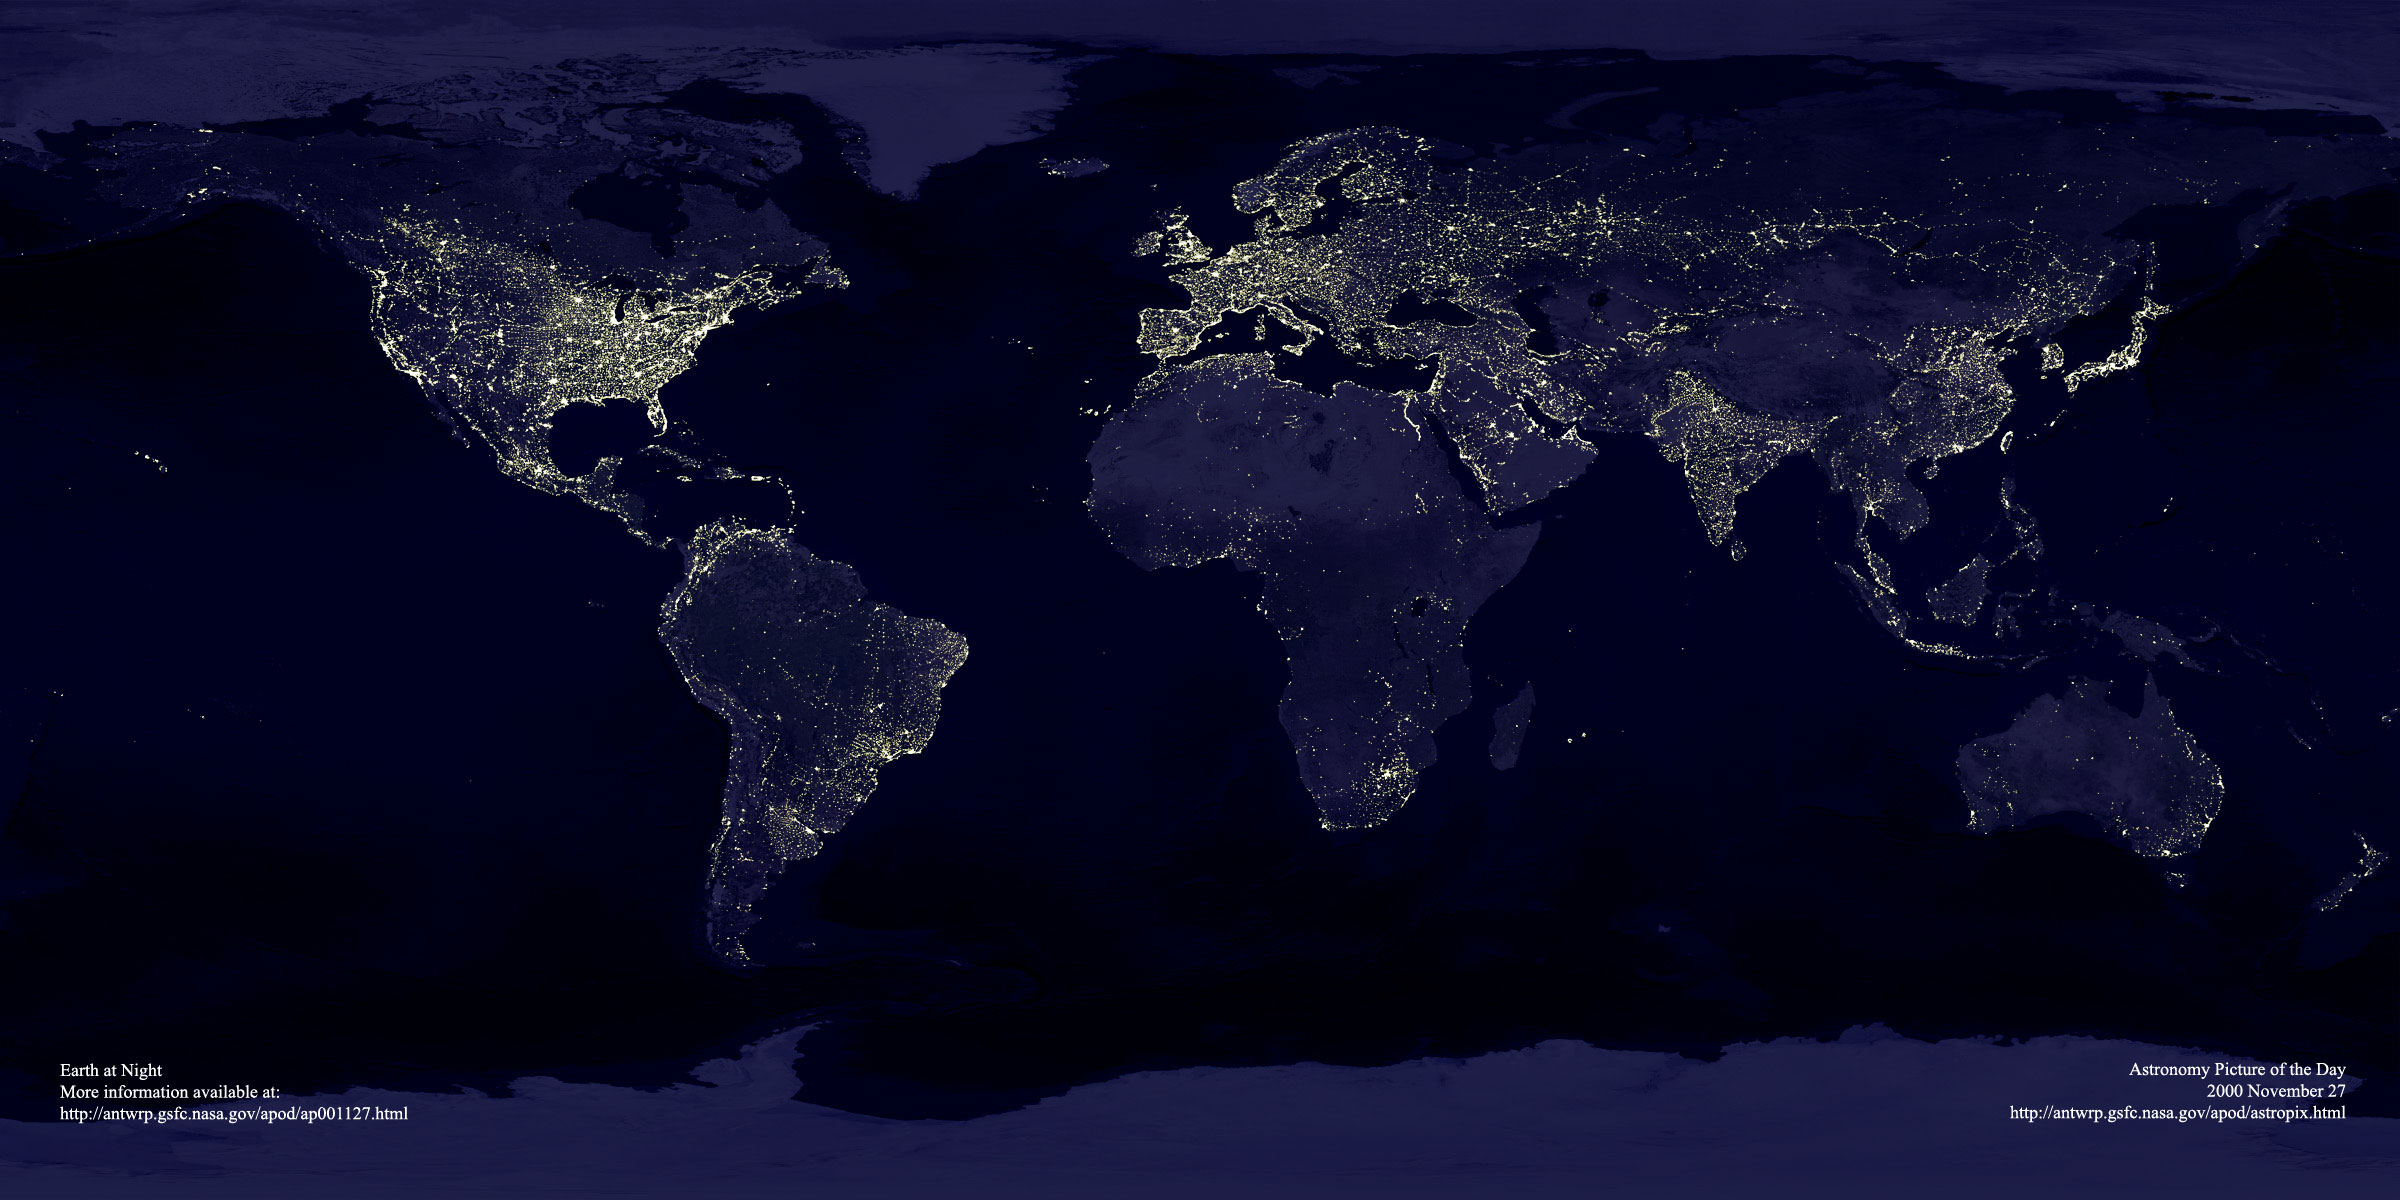
Noèni pogled na Zemljo. Jasno so vidna obmoèja gostejṗe naselitve in velikih mest, kjer je moèna noèna aktivnost. V predelih brez mest nisvetlobe.
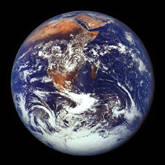
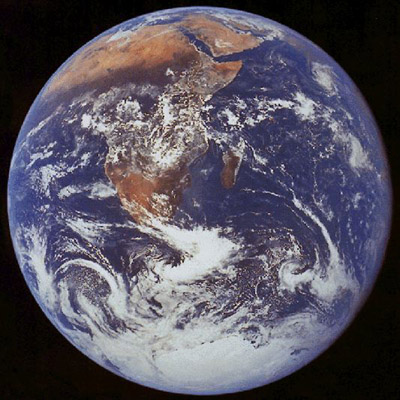 Pogled Apolla 17 na
Zemljo
Pogled Apolla 17 na
Zemljo
Hurikan Andrew
Vir: F. Hasler, M. Jentoft-Nilsen, H. Pierce, K. Palaniappan, inM.
Manyin. NASA Goddard Lab for Atmospheres - Podatki iz National Oceanic and
Atmospheric Administration (NOAA)
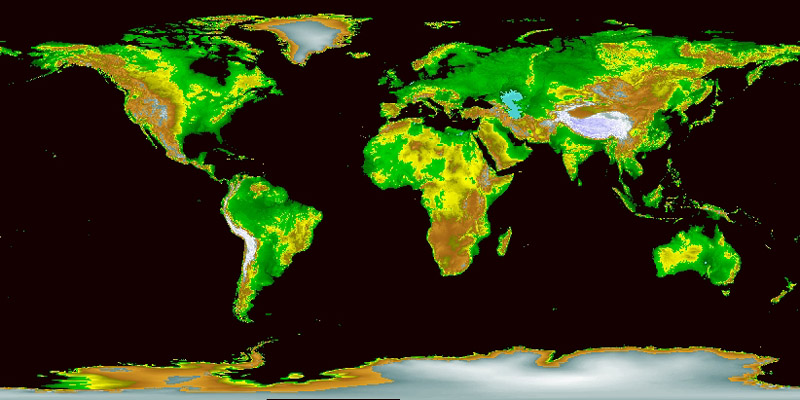 Globalna topografija
Zemlje
Globalna topografija
Zemlje
NAjniṁja obmoèhja so temno zelena; najviḟja obmoèja pa so bela - z izjemo juṁnega
teèaja za katerega ni celotnih podatkov.
Vir: National Geophysical Data Center
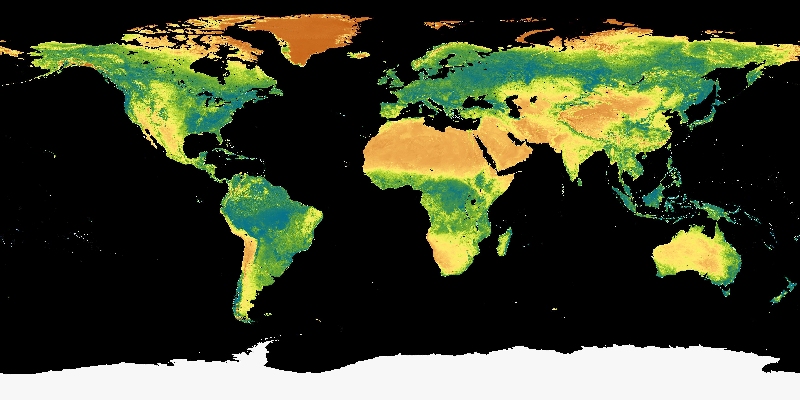 Zemljevid vegetacije
na Zemlji
Zemljevid vegetacije
na Zemlji
Jasno so vidne puḟèave, kot npr. Sahara v Severni Afriki kakor tudi obmoèja
tropskega rastja ob ekvatorju. Velika obdelovalna obmoèja centralne Evrope
in srednje Amerike so na karti tudi lepo vidna
Vir: National Geophysical Data Center
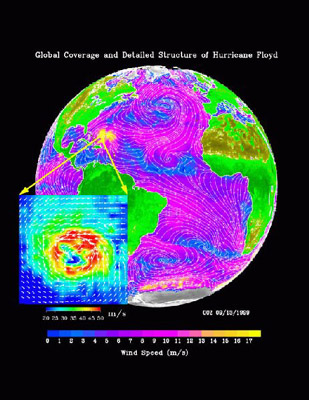 Vetrovi nad oceani
Pogled na vzorce vetrov nad Atlantskim oceanom leta 1999. Nas liki vidimo
dve vrsti podatkov za vetrove: smeri vetrov (bele èrte) in hitrosti vetra
(barvni zemljevid). Vstavek je slika hutikana Floyd. Lepo vidno je gibanje
vetrov znotraj hurikana v smeri nasproti urinim kazalcem in mirno podroèje
v sredini hurikana.
Vir: NASA/JPL
 El Nino
©tiri slike prikazujejo spremembe viḟine morske gladine v zaporedju ḟtirih
mesecev leta 1997. Bela obmoèja pomenijo dvig med 14 in 32 cm preko normalne
gladine; rdeèe pomeni spremembo okoli 10 cm . Zelena obmoèja so obmoèja normalne
viḟine, rozasta pa pomenijo najmanj 18 cm padca gladine. Sprememba lege tolikḟne
kolièine vode pogojuje tudi oblikovanje padavin in ostalih podnebnih lastnosti.
Vir: NASA/JPL
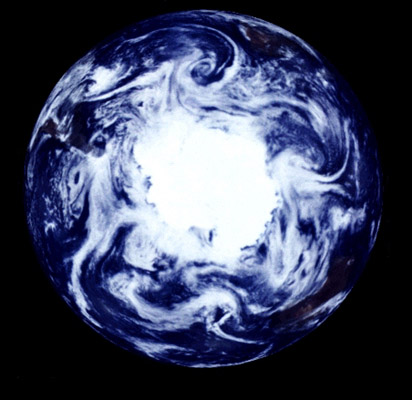
Juṁni teèaj
This unique image shows a physically impossible view of Antarctica and the
southern hemisphere, since in reality at least half the image should be in
darkness. It was created by piecing together images taken by Galileo (en route
to Jupiter) over a 24 hour period. Just visible are South America - middle
left, South Africa - upper right and Australia - lower right.
Vir: NASA/JPL
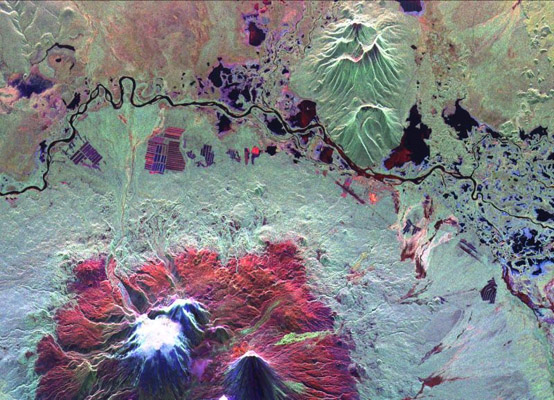 Vulkan Kliuchevskoi
A radar image of the Kliuchevskoi volcano around the time of an eruption in
September 1994. Kliuchevskoi is the white peak surrounded by red slopes in the
lower half of the image. Covering an area of 30 km by 60 km (18.5 miles by 37
miles) the image was acquired using radar instruments on the space shuttle.
Flowing from left to right across the middle is the Kamchatka River with an
older volcano visible north of the river. New lava flows appear yellow/green
in the image and are clearly visible on the flanks of the volcano.
Vir: NASA/JPL/NIMA
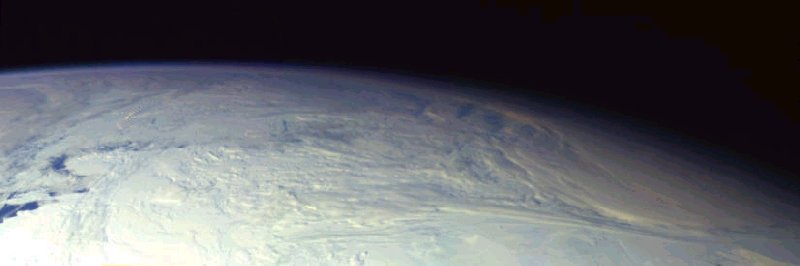 Antarktika
The limb of the Earth looking over Antarctica as imaged by the Galileo satellite.
On the right side of the image is the day-night terminator. The visible areas
of Antarctica are south of South America near the Amundsen Sea. The Earth's
atmosphere can be seen along the left of the limb as a thin purple-blue band
just above the surface.
Vir: NASA/JPL
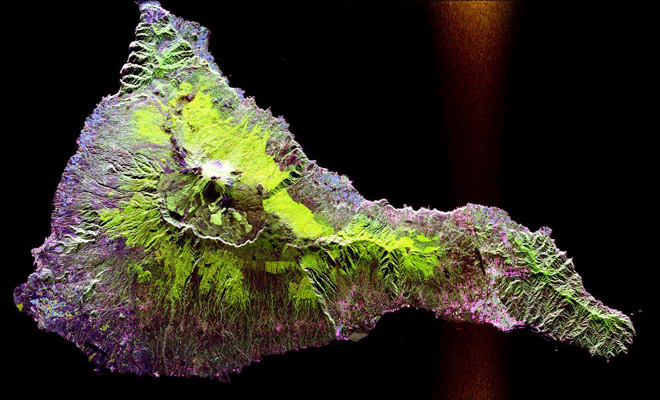 Vulkan Teide
Tenerife, one of the Canary Islands off the west African coast, is dominated
by the Teide Volcano, which last erupted in 1909. The summit crater is clearly
visible to the left of center in this image. Along the ridge below the summit
is the site of an astronomical observatory. The purplish regions around the
edge of the map represent the towns on the island - all of which could be at
risk if Teide were to erupt again. Images like this one help scientists understand
how volcanoes form - knowledge that can be applied to other volcanoes in the
Solar System.
Vir: NASA/JPL/NIMA
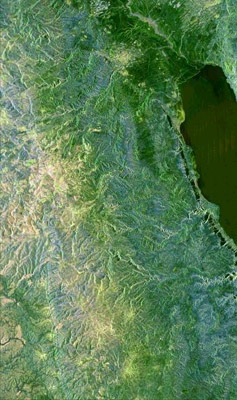 Title:Jerusalem
in Mrtvo morje
Title:Jerusalem
in Mrtvo morje
A radar image of the region surrounding Jerusalem and the Dead Sea. The Jordan
River can be seen in the top of the image flowing into the Dead Sea. The large
bright region on the left edge is the ancient city of Jerusalem with the city
of Hebron being the bright area to the south of the image. The Dead Sea is the
lowest point on the Earth's surface - about 400 m (1,300 feet) below sea level
- and was probably formed by an earthquake. The whole region lies on an active
fault and rift system that extends from Turkey to Africa. As well as creating
the Dead Sea, tectonic activity is probably responsible for the undulating nature
of the surrounding terrain.
Vir: NASA/JPL/NIMA
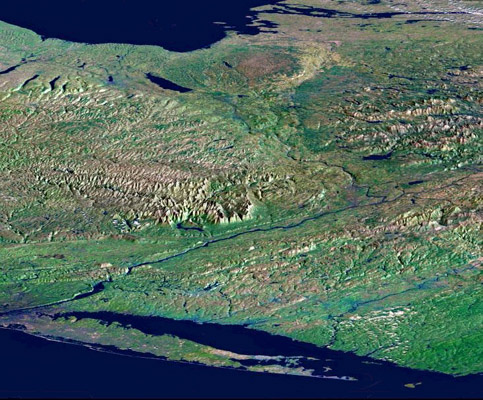
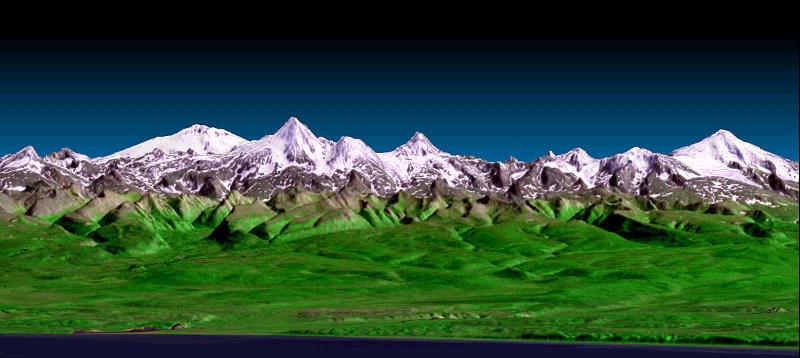 Polotok Kamchatka
By combining data from different missions it is possible to create some striking
images of planet Earth. This image, of the Kamchatka Peninsula in eastern Russia,
combines topographic relief data from the recent Shuttle Radar Topography Mission
and true-color from the Landsat 7 satellite. In the foreground is the Sea of
Okhotsk, with the skyline being filled by Sredinnyy Khrebet - a volcanic mountain
range. By overlaying the Landsat data it is also possible to sense the change
from lush vegetation down by the coast to the hostile snow capped peaks in the
background. The heights in this image have been exaggerated by a factor of 3.
Vir: NASA/JPL/NIMA
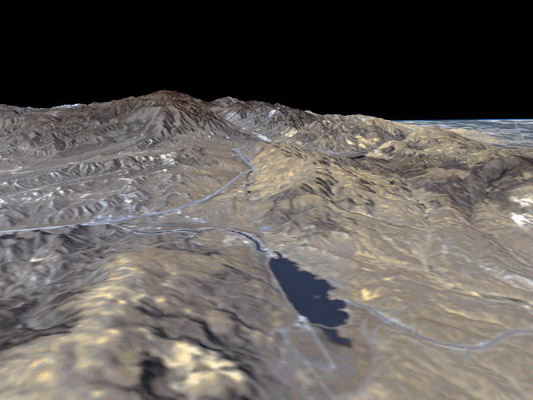 Prelomnica Svetega Andreja
This Shuttle Radar Topography Mission (SRTM) image is of a region of the San
Andreas Fault about 100 km (60 miles) north-west of Los Angeles. The fault is
an active region between the North American plate, on the right, and the Pacific
plate, on the left. From this point of view the Pacific plate is moving away
from the observer, the North American plate towards. Images like this one are
used by geologists to study fault dynamics and the landforms that result from
tectonic activity. The heights in the image are exaggerated by a factor of 1.5.
Vir: NASA/JPL/NIMA
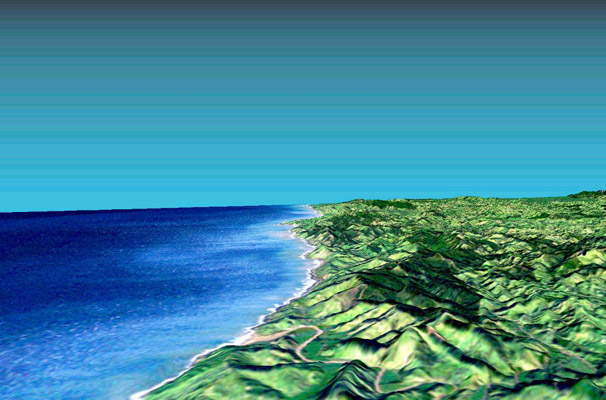 Owahanga, Nova Zelandija
A view south along the southeast coast of North Island in New Zealand. The capital,
Wellington, is off the right hand side of the image. The foreground river reaches
the coast at the town of Owahanga. Castlepoint can be seen in the middle of
the image jutting out into the sea. The color has been added from Landsat data
with the dark green areas corresponding to thick pine forests.
Vir: NASA/JPL/NIMA
 Drṁava New York
Shuttle Radar Topography Mission (SRTM) data has been used to create this image
of New York State from Long Island, at the bottom of the image, to Lake Ontario,
at the top of the image. Running from right center across the scene to the lower
left edge is the Hudson River, becoming visibly wider as it approaches New York.
Running parallel to this is the Connecticut River. The small, elongated lakes
towards the top left-hand corner are believed to have been carved out by glacial
activity as recently as 18,000 years ago.
Vir: NASA/JPL/NIMA
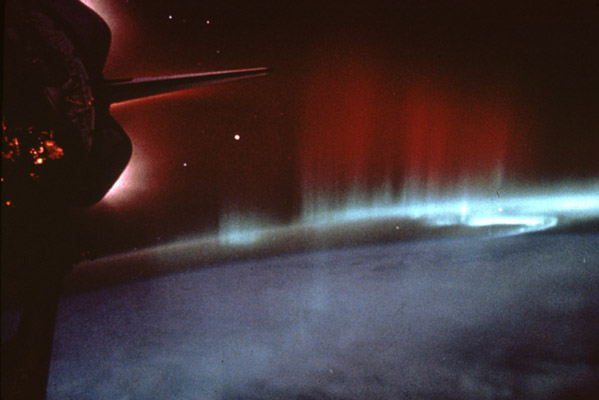 Aurora Australis
The Aurora Australis, or Southern Lights, as seen by the crew of the Space Shuttle
Discovery during the STS-39 mission. The aurorae are created by the emission
of light from oxygen and nitrogen that is excited by electrons accelerated in
the Earth's magnetic field. The visible aurorae are dominated by green and red
emissions from oxygen and blue or purple from nitrogen. Auroral activity is
always visible in polar regions as this is where the Earth's magnetic field
lines are more densely packed. Mid-latitude aurorae are visible only when solar
flares, or coronal mass ejections, disturb the Earth's magnetosphere.
Vir: NASA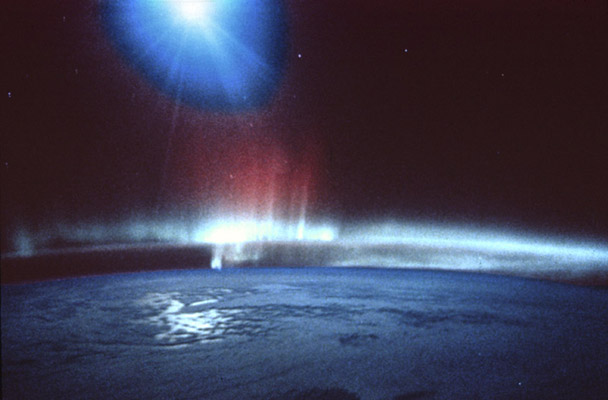
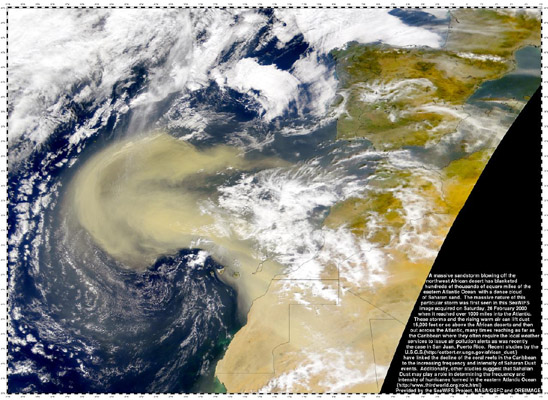 Saharski vihar
The SeaWiFS instrument sits in a low Earth orbit monitoring changes in the world's
climate. On 26th February 2000 SeaWiFS returned a remarkable image of an enormous
cloud of dust leaving the Sahara desert in northwest Africa. There are indications
that the dust from these storms has an impact on the global environment. The
storms are attributed to the decline in coral reefs in the Caribbean, an increased
number of hurricanes and provide nutrients to the Amazonian rain forests.
Vir: SeaWiFS Project, GSFC, NASA
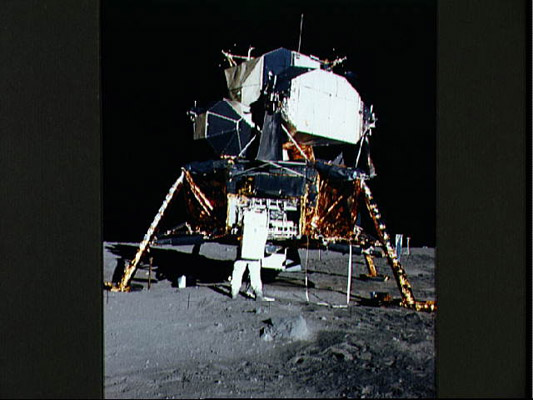 Apollo 11 Lunar Module
A view of the Apollo 11 Lunar Module 'Eagle' as it stood on the surface of the
Moon. Apollo 11 touched down on the surface of the Moon on 20th July 1969. The
upper portion of the lunar module would separate from the lower stage to return
to the orbiting Command Module. Neil Armstrong and Edwin 'Buzz' Aldrin became
the first people to set foot on another world. They spent a mere two and a half
hours on the lunar surface in which time they were able to collect some rock
samples, position a US flag and commemorative plaque and talk to the President
of the United States.
Vir : NASA